
Multifamily REITs: The Buyer Nobody’s Pricing In | October 2026
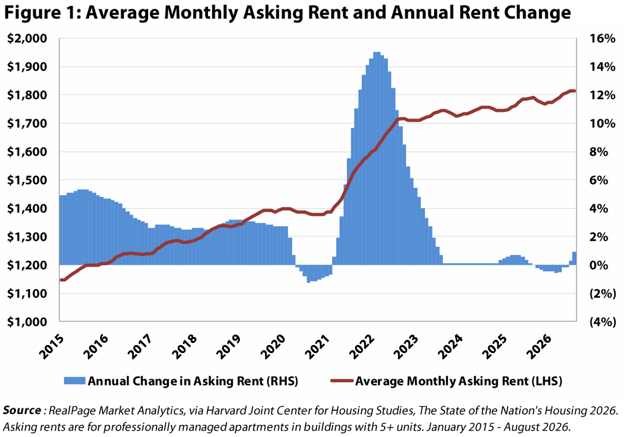
When we last wrote about multifamily in our February 2024 REIT Outlook, the story felt simple: a 50-year peak in deliveries, collapsing starts, the Fed nearing the end of its hiking cycle, and a rent recovery on the other side. While the supply call was right, apartment rents have been essentially flat since late 2022 (Figure 1) and the stocks have traded accordingly.
–
–
So, what are you getting when you buy apartment REITs today? The REITs own institutional quality portfolios trading at low-6% implied cap rates and ~15-25% discounts to net asset value (NAV), carry low-levered balance sheets with well laddered maturities, and are run by the best operators in the business. With the sector at the bottom of its cycle, the question isn’t whether things get better from here, but who is positioned to benefit when they do.
–
What we didn’t see in February 2024 was the other half of the story. The 2020-2022 vintage of private, floating rate apartment debt was issued against valuations at ~4% cap rates and near-zero SOFR, then extended in 2023 and 2024 on the assumption of rate cuts and a rent recovery ahead. Throw in a rate hike, flat rents, and exhausted sponsors who no longer want to write checks, and a quarter of those loans can no longer cover their debt service.
–
Meanwhile, the REITs are in the same business but sit in a completely different position. The public side has investment grade balance sheets and platforms to buy what the private side has to sell, build when virtually nobody else can, and consolidate to grow scale, as AvalonBay and Equity Residential just did to form Vivmark Residential (NYSE: VMRK). The last time the capital markets shut down for an extended period, it took four years after the 1986 Tax Reform Act for the buildings to reach the new buyers, and the only apartment REIT of size at the time, United Dominion, now UDR (NYSE: UDR), tripled its unit count buying from the lenders. By 2031, when even the ten-year fixed-rate money from 2021 has rolled, the REITs should own a meaningfully larger share of the country’s apartments than the 2.3% they hold today.
–
Looking Back at 2024
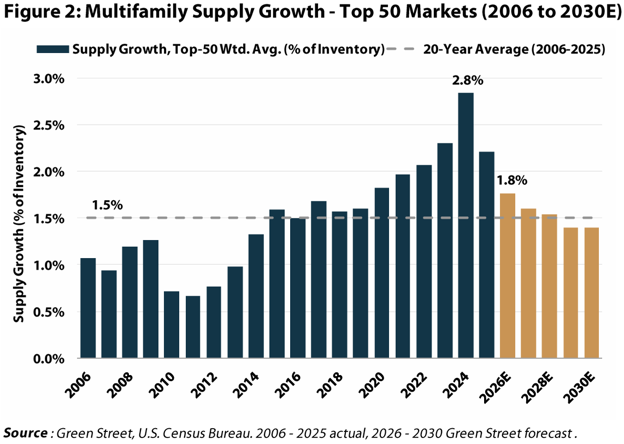
In February 2024, we anticipated supply peaking in late 2024, ultimately driving a rent recovery in the back half of 2025, all while stocks traded at a 15% discount to NAV. Our supply call was right: deliveries peaked at 2.8% of inventory in 2024, a 50-year high (Figure 2). However, the decline was more gradual, with 2025 (2.2%) and 2026 (1.8%) deliveries staying above the 20-year average, and alongside elongated lease ups, the rent recovery got pushed out further. To corroborate, Green Street’s 2026 same-store net operating income (NOI) estimate for the apartment REITs was +4.1% when first printed in March 2023. Today, that estimate has fallen to +1.2%, while 2027-2028 estimates have been revised up on hopes of a further-delayed recovery.
–
–
The distress we expected from the 2020-2022 vintage took longer to arrive than we thought. Every loan is a bet on where the property will be two to three years out, and the lenders extending in 2023 and 2024 were betting on rate cuts and a rent recovery. Today, we’re seeing the opposite with rents still flat and the Fed hiking. At 25% leverage and carrying long term below-market fixed rate debt, the REITs can afford to wait. The private side, with 65-75% loan-to-value (LTV) ratios and floating rate debt, could be a ticking time bomb.
–
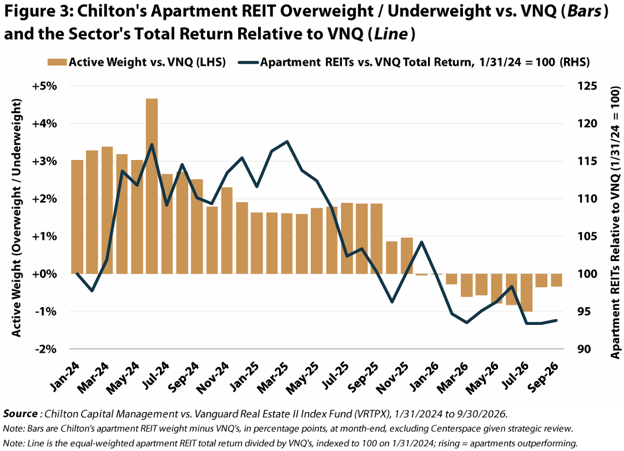
For what it’s worth, we came into 2024 about 300 bps overweight the apartment REITs relative to our primary benchmark, the Vanguard Real Estate ETF (NYSE: VNQ), and modestly added through the spring (Figure 3). In the 11 months that followed our REIT Outlook, the sector outperformed the REIT universe by ~1,700 bps, generating a total return of +27% versus +10% for the VNQ. We began trimming into the outperformance in the back half of the year and slowly let our position drift towards neutral as the stocks gave back their 2024 outperformance in 2025. We have continued to trim this year, and we currently maintain an equal weight position relative to the benchmark.
–
–
Why the Stocks Haven’t Worked Since 2021
2021 was the peak of everything. Rent growth was double-digit, apartment REITs traded at ~27x FFO, private buyers were paying 4% cap rates with floating rate debt, and the UST 10-year yield sat near 1.5%. Cheap money was quietly funding the largest supply wave in 50 years, and by industry estimates, roughly two-thirds of all apartments were either refinanced, sold, or built in 2021 and 2022 alone. In other words, two-thirds of the private market has a 2021 ‘V’ baked into its LTVs.
–
That rent surge showed up in the REITs’ earnings with a lag, and then stopped altogether. Camden Property Trust’s (NYSE: CPT) Core FFO per share went from $5.39 in 2021 to $6.82 in 2023, up 26%, and has guided to $6.75 this year; Mid-America Apartment Communities (NYSE: MAA) went from $7.01 to $9.17, and is guiding to $8.53 this year. The coastal names held their ground a bit better, but since 2023, earnings across the group have plateaued. Three years of excess supply and higher interest expense took the growth to zero, and for MAA a bit below its 2023 peak.
–
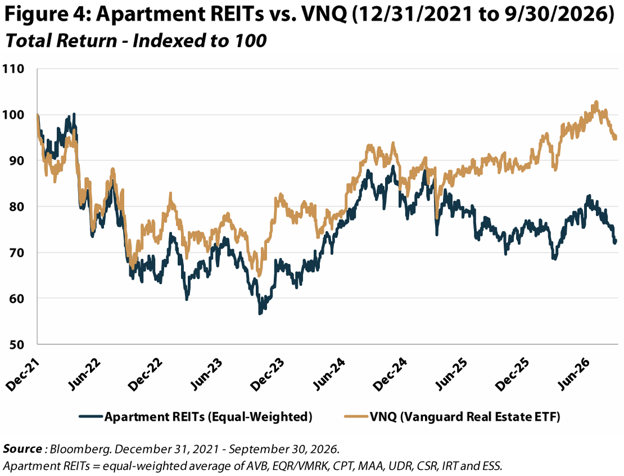
Since the end of 2021, the apartment REITs have generated a total return of -28% versus -7% for the VNQ through September 30, 2026, and this year alone the group has lagged by ~1,000 bps as the rent recovery got pushed out yet again (Figure 4). The discount and lack of enthusiasm were justified next to sectors with better fundamentals such as healthcare and data centers. But no other sector’s private owners borrowed floating rate debt at the top in 2021 at the scale apartment buyers did, partly due to the prevalence of agency (Freddie Mac, Fannie Mae) debt available at below market rates to apartment owners. While these loans were already under pressure in 2023-2025, the time of reckoning may be near for these 2020-2022 vintage loans.
–
–
The Private Side is Hitting the Wall
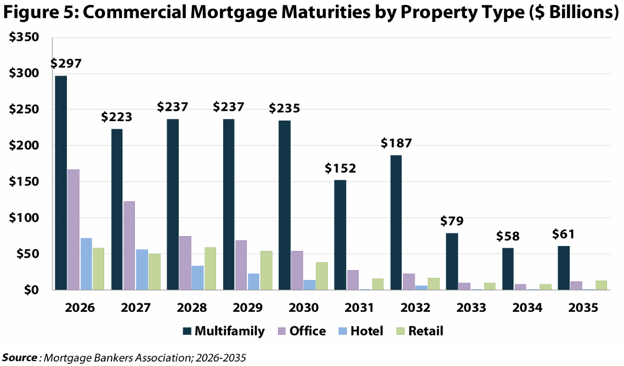
Over the next decade, U.S. apartment landlords face more than $1.8 trillion in debt coming due, with ~$757 billion maturing from now through 2028, the most of any property type (Figure 5).
–
–
With the Fed hiking on September 16 and the UST 10-year yield above 5%, that debt is being refinanced at nearly double the ~3% rates of 2020-2021. The extensions granted in 2023 and 2024 assumed the opposite.
–
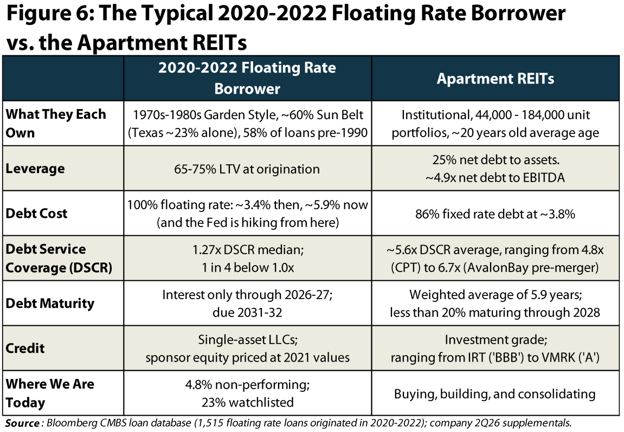
After looking through the ~$42 billion of floating-rate apartment loans originated and securitized in 2020-2022 using Bloomberg’s CMBS loan database and servicer reports, we found 1,515 unique loans predominantly backed by 1970s and 1980s garden product in the Sun Belt, financed at 65-75% LTVs at origination, with three to five years of interest-only and a 2-3-year rate cap. At closing, the loans’ median coupon was ~3.4%. Before the September rate hike, it was 5.9%, and the Fed is projecting further rate hikes. In comparison, the apartment REITs are in the same metros with newer buildings, possess a third of the leverage, 86% fixed rate debt at ~3.8%, a weighted average debt maturity of 5.9 years, and cover their debt service at five to six times, not 1.3x (Figure 6).
–
–
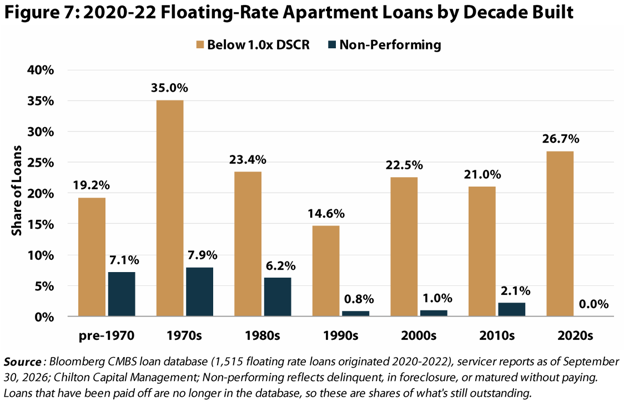
Of the 1,515 loans analyzed, roughly one in four is not covering its debt service today, but only one in twenty is actually non-performing (delinquent, in foreclosure, or matured without paying). Taking a closer look at who’s actually stopped paying, it’s overwhelmingly the older buildings. Loans on properties built before 1990 are ~7% non-performing and everything built since is only ~1%. However, when looking at who isn’t covering their debt service… it’s nearly one in four across every decade built (Figure 7). The newer buildings are ‘performing’ because the sponsor is still making up the difference every month, and this is the part we’re watching most closely, especially for the newer product that could fit the ‘buy-box’ for REITs.
–
–
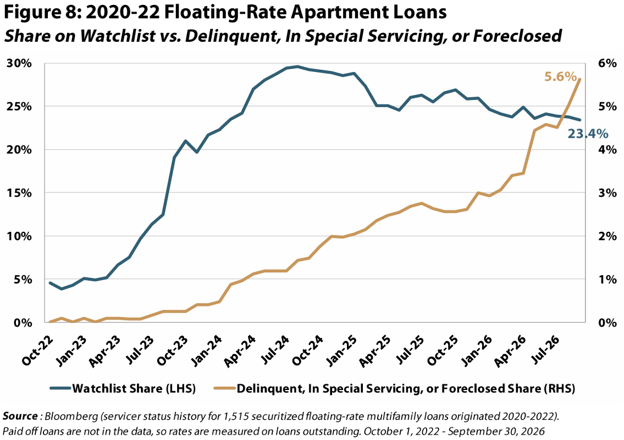
Additionally, when counting loans in special servicing alongside the delinquent and foreclosed ones, the share in trouble has more than doubled over the past year, going from 2.6% to 5.6%, while the watchlist has simultaneously been shrinking (Figure 8). Trepp’s market-wide multifamily CMBS delinquency rate of 7.7% in August 2026 against 1.8% in March 2024 tells the same story.
–
–
As for loans that went bad, they spent a median 19 months on servicer watchlists first, and 354 loans with ~$10.7 billion of balance are on one today, still paying but only at 0.96x coverage. The stat to keep top of mind: loans with a debt service coverage ratio (DSCR) below 1.0x are 15% non-performing compared to less than 2% of loans above 1.0x.
–
Most of these 2020-2022 loans contained up to five years of interest-only, meaning principal payments could start in the coming months. In one 2022 Freddie Mac deal, 21 of the 25 loans still outstanding start amortizing between November 2026 and January 2027, and that step alone takes the share of balance not covering its debt service from a third to half at today’s coupons, and to nearly two-thirds if the Fed’s projected rate path proves true from here. None of the loans in this deal has to be paid off until 2031, but with potentially two-thirds of the balance not covering its debt service, sponsors are left with two choices: write bigger checks, or pull the plug.
–
Looking forward, if loans keep moving from the watchlist into delinquency and special servicing at the same pace they did over the past year, 8.4% of loans and 10.7% of the total balance will be there by September 2027, before factoring in the September hike or the ones the Fed is projecting. In other words, delinquencies and foreclosures are going to get much worse from here.
–
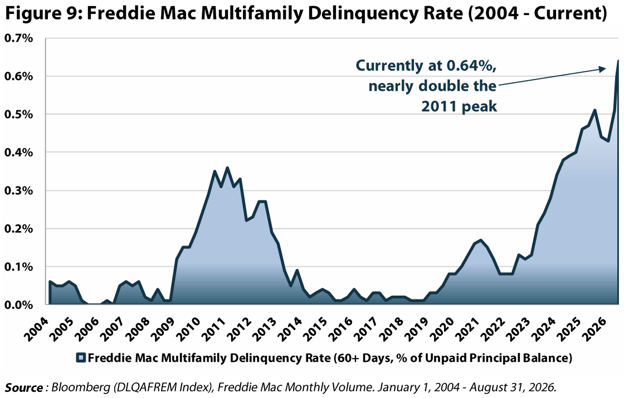
For clarity, about 60% of these loans sit in Freddie Mac’s securitized K-deals, the rest mostly in debt-fund CRE CLOs, and Freddie’s own numbers are starting to show it (Figure 9). Note that its multifamily delinquency rate is only 0.64% because ~85% of its $505 billion book is fixed-rate and paying… but the August reading is the highest in the history of the series, up again from July, nearly double the 2011 peak and up from 0.07% four years ago.
–
–
One of those loans is right here in Houston’s Medical Center. A 793-unit complex built in 1972 was refinanced in December 2020 with an $84 million floating rate loan from Freddie Mac, representing a 75% LTV off its $113 million appraisal at the time. SOFR went from near zero to over 5%, bringing its annual debt service from $2.4 million in 2021 up to $6.0 million by 2024. NOI never came close to $5.5 million pro forma at underwriting, with its best year coming in at $4.2 million in 2025. The rate cap expired in January 2024 (and wasn’t replaced that we can tell), principal payments started this January, and by June 2026, the borrower had stopped paying and the lender had called the loan. A June appraisal came in at $60 million, a mere $76,000 per unit and 47% below 2020, which puts the loan at 139% of the building’s value.
–
This isn’t just one property, though. The sponsor’s equity is typically what goes first, and it’s already happening. S2 Capital, one of the largest apartment syndicators in the country, dissolved its fund in July and returned nothing to its investors. Lurin Capital, another Sun Belt syndicator, filed for Chapter 11 in April. Even Blackstone defaulted on a $90 million Dallas apartment loan in June!
–
According to the Mortgage Bankers Association (MBA), half of the ~$2.3 trillion of total apartment debt outstanding sits with Fannie and Freddie, 29% with banks, 11% with life insurers, and only ~3% in private CMBS and CRE CLOs. Delinquencies on banks’ apartment loans sit at 1.4%, their highest since 2013 per FDIC data, but still only a quarter of the 2010 peak. The 2020-2022 floating rate loans, which largely went to Freddie and the debt funds, run closer to 6%. While specific, this vintage represents well over $100 billion of debt, about the size of the entire public apartment REIT sector. The $42 billion we analyzed is what’s still outstanding and reports every month, but only reflects a sample of the problem, not the true size of it. Others may be in better shape, but more than likely, are similar or worse.
–
If new equity isn’t willing to step in, the lenders decide what happens next, and multifamily today looks a lot like office in 2023 when lenders started taking the keys back and the first distressed sales were marketed at deep discounts. Unlike the GFC, when bailed out banks could extend and pretend for years, lenders today are better capitalized and should be less willing to wait. According to MSCI, distressed deals made up 4.7% of second quarter apartment sales, up from 1.5% a year ago. The whole sector has struggled through three years of flat rents and record supply, private and public alike. The difference now is which side of the coming distress you’re on.
–
Why the REITs Are on the Right Side
A more complete comparison is presented above in Figure 6, but at a high level, as of June 30, 2026, the apartment REITs carry ~25% net leverage and ~4.9x net debt to EBITDA, with ~86% of debt fixed at ~3.8%, a 5.9-year weighted average maturity, and less than 20% of debt maturing through 2028. That’s why the group carries its investment grade ratings, ranging from ‘BBB’ for Independence Realty Trust (NYSE: IRT) to ‘A’ for Vivmark, and why the 2021 buyer’s problem isn’t theirs.
–
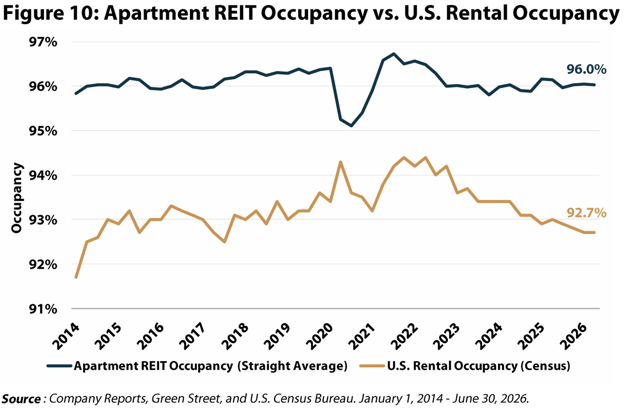
Financial constraints filter to the operating level too, as owners struggling with debt service often defer maintenance, lose residents, and lose more coverage along the way. We’ve watched occupancy at a couple of these loans fall into the 60% range in under a year. The REITs never had to choose between a mortgage payment and a broken elevator, and have therefore maintained occupancy at 95-96% through the worst supply wave in 50 years, well above national occupancy (Figure 10).
–
–
With construction costs up 17% and rents up only ~4% since 2023, according to Green Street, development is increasingly difficult to pencil. Some portfolios are now being pitched at ~30% below the broker’s own estimate of what it would cost to build those properties today, meaning the 2021 buyer effectively paid more than it costs to build them now. Camden currently trades 35-40% below its replacement cost, and its portfolio is roughly 25 years younger than the median building behind these loans.
–
Even at this sizable discount, REIT buyers should be looking for positive leverage and ideally nothing built before 2000. With ten-year secured debt at ~6% against high-4% to low-5% cap rates for Class A product (where the REIT portfolios sit), something has to give. In the interim, the REITs are taking advantage of the dislocation. Camden, for example, sold its 19-year-old California portfolio for ~$1.6 billion in July at a ~4.9% cap rate for the buyer, redeployed proceeds into five-year-old Sun Belt assets at a similar cap rate, and bought back ~$700 million of its own stock at an implied ~6.4% cap rate. The damage is concentrated on owners who bought older properties on short-term debt and lofty expectations. The REITs are the other side of that trade.
–
Within the loans we can see, 109 properties built since 2000 aren’t covering their debt service, and 39 of them are the kind of asset a REIT would actually own: institutional quality, 150+ units, located in existing REIT markets such as Houston, Austin, Atlanta, and the Bay Area, 91% occupied, and still current on their loans – for now. The 39 properties make up ~11,300 units, roughly the size of Vivmark’s entire development pipeline, and were financed at two-thirds of their 2020-2022 valuations. And that’s before the merchant builders who financed 2024 and 2025 lease-ups on three-year floaters and whose equity partners have yet to accept the loss. While these properties aren’t for sale until the sponsor decides they are, the triggers of rate caps expiring and principal payments starting are quickly approaching. As a reminder, the last time this happened, UDR tripled in size.
–
The Bull Case: A Bigger Share of the Pie
While a bull case for the apartment REITs could very well take shape at some point, and we can see how it would start, we don’t expect it in the very near term. The bull case rests on four factors: 1) new supply shutting off, 2) demand holding steady and rents finally turning, 3) the REITs scaling up market share as the private side sells, and 4) the public market sentiment turning positive, giving the group a green light to grow for the first time in years. What this Outlook unfortunately can’t predict is when, as the sequence has to run its course first. Headlines will get worse before they get better, cap rates have to rise, and acquisitions will stay on pause until the bid-ask spread closes, which takes time. The equity cost of capital will eventually make sense again, but as of this publication, it does not.
–
First, supply. As shown earlier in Figure 2, supply growth as a percent of existing inventory peaked in 2024 at 2.8% and is expected to fall to ~1.5% by 2028, back to its 20-year average. With development economics that don’t pencil and rates rising sharply over the past month, we believe the risk to those estimates skews towards lower future deliveries, not higher. Even if 2027 turns out to be a great year, builders wouldn’t restart until 2028 and new supply wouldn’t arrive until 2030 at the earliest, given a year for permits and two to three more to build.
–
Second, demand. Retention is at or near record levels, absorption has kept pace with elevated supply, and with mortgage rates back over 7%, renting is once again cheaper than owning in all 50 major metros, as we stated in our October 2024 REIT Outlook. Anecdotally, Camden’s new lease rates for 3Q26 should sequentially improve for the first time in five years, blended rate growth turned positive in June, and fall renewals went out at +4.2%. Similarly, IRT now has 13 of its 22 markets showing positive new lease spreads in August, improving from seven markets in the second quarter and 11 in July.
–
Third, market share. Apartment REITs owned ~1.4% of the country’s apartments in the mid-1990s and only ~2.3% today. The share has stayed that low because private owners had access to cheap agency financing to outbid the REITs’ balance sheets, and the 2020-2022 floating-rate vintage is the first time the private owner can’t refinance while the REITs can. For comparison, the public storage REITs, whose private competitors never had an agency lender, went from a mid-single-digit share of their industry in the mid-1990s to roughly a third of U.S. square footage today, according to Extra Space (NYSE: EXR). At a September conference, Vivmark’s CEO said that “scale is going to matter more over the next five to 10 years than it has over the last 10.”
–
Fourth, the public market would need to give the REITs a green light. If the stocks can get back to trading at or above NAV, the ability to issue equity opens up, and with it the ability to fund accretive acquisitions from a private market with few competing bids, or fund development delivering into minimal supply, either of which grows FFO per share and supports the multiple. Back in 2024, the last time AvalonBay traded near NAV, it raised ~$890 million to fund its development pipeline. The Sun Belt names haven’t been able to raise equity since early 2022. The market has been slow to give the group that green light through three years of weak fundamentals, but the signs we’ve been waiting for are in the early stages of showing up, and management teams appear willing to close the gap themselves, even if it means forming a new company to do so.
–
The honest uncertainty is timing. One of the REIT executives we spoke with described the sequence the same way: cap rates have to expand, the older assets will reprice first and hardest, and the buying opportunity arrives when sponsors accept the loss. That said, the stocks haven’t always moved solely on fundamentals. UDR was the only apartment REIT of any size in 1990, and its stock bottomed that fall at the depth of the S&L crisis. Over the next three years, the company bought from the distressed lenders, tripled in size, and its stock price nearly tripled as well, all before its own occupancy and rents had come back. While falling rates helped every REIT in those years, UDR managed to beat the index by roughly 80 percentage points, and even beat it again when rates spiked in 1994. The late Sam Zell was buying the same apartments from the government’s S&L cleanup with private money, and in 1993 he took them public as Equity Residential to get permanent capital, a deal our own Bruce Garrison helped bring to market. All things considered, the winners of the last cycle were those that had the cost of capital to buy when lenders were selling, and some of the best companies emerged to become successful public REITs.
–
Consolidation: Using Scale to Close the NAV Gap
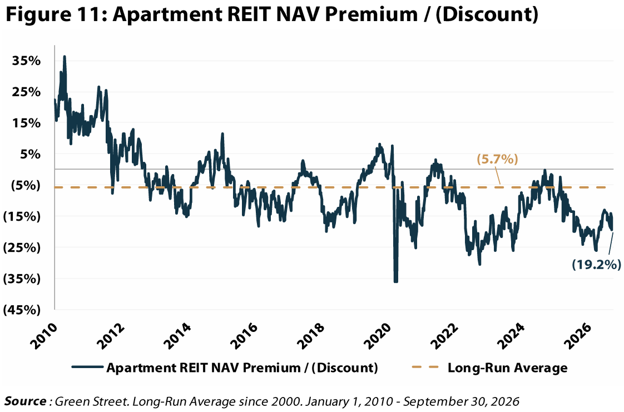
Apartment REITs have traded ~15-25% below NAV for three years now (Figure 11), and scale remains the one lever the REITs still control. AvalonBay and Equity Residential, the two largest apartment REITs, completed a ‘merger of equals’ in August to form Vivmark Residential. The combined company owns 184,000 homes, has an enterprise value of ~$71 billion (2.5x vs. the next largest apartment REIT), a $4.4 billion development pipeline that management plans to double, and received an S&P upgrade to ‘A’ on day one. Vivmark expects $175 million of gross synergies, about $115 million coming from cutting duplicative public company, payroll, and other administrative costs. All synergies are slated to be in place by early 2028, and Vivmark, according to our own estimates, is expected to produce some of the best earnings growth in the sector over the next two years.
–
–
At the other end of the spectrum, Centerspace (NYSE: CSR) ran a lengthy strategic review from November through June, concluded it couldn’t close the discount on its own, and agreed in September to sell itself to IRT in an all-stock deal. Both names traded well below NAV, so scale was the only lever left, and the combined company anticipates ~5% accretion, at minimum, to 2027 Core FFO on a leverage neutral basis. The deal is expected to close by year-end with an enterprise value of ~$8.1 billion across 44,000+ homes in the Sun Belt and Midwest. And, for when the public market won’t pay NAV, private capital sometimes will… Veris Residential agreed to be taken private in February at a ~23% premium to its unaffected share price. However, with rates up since then, the ‘take-private’ route looks less likely by the day, leading to consolidation as the answer instead.
–
Chilton’s Positioning
Multifamily is a neutral weight for us at ~6.4% of the composite, concentrated in Vivmark and Camden, and while tempting to add selectively on the recent pullback, we’re remaining patient here. The better entry likely comes after cap rates and NAVs have reset and the group can once again raise capital near NAV. Until then, we’d rather own the two names with the best balance sheets and the most to gain from that turn. Vivmark’s best-in-sector earnings growth, differentiated scale, and attractive valuation make it the most compelling name in the group. Camden, meanwhile, has one of the cleanest balance sheets in the REIT universe, the youngest portfolio in the sector, and we commend their capital allocation prowess so far this year regarding the California sale, 1031 Sun Belt acquisitions, and accretive share buybacks. We also owned Centerspace until early June and exited once the strategic review ended. The IRT deal three months later brought the stock back up, but it still trades below where we sold it.
–
What Would Change Our Mind & Risks
The bull case predominantly rests on 2027 rents bouncing back, so the risks are anything that pushes that recovery out again: 1) new lease pricing fades into year-end like it did in the second half of 2025; 2) the supply forecast ticks back up; 3) a rate hike turns into a hiking cycle, taking cap rates and stock prices with it; and 4) the merger synergies don’t deliver as expected.
–
This year’s leasing season looked “normal” for the first time since the pandemic, with Camden guiding new lease rate growth to improve from 2Q to 3Q for the first time since 2021. Starts are effectively shut off with elevated construction costs and a UST 10-year north of 5%. The multifamily REITs trade at implied cap rates ~50-100 bps above where comparable transactions are clearing, providing a real cushion if cap rates shift higher. And Vivmark’s COO described the synergy work as being like “a kid in the candy store.” What would change our mind is timing and if pricing rolls over again like it did last year.
–
Conclusion
Multifamily has been a frustrating sector to be invested in over the past three years. Supply kept coming, rents were flat, and the earnings growth from the post-pandemic rent surge has stalled. That frustration is evident in the REITs’ share prices, but public market investors seem to be ignoring what’s happening on the private side. The floating-rate loans written at the top are failing on coverage rather than maturity, the servicer watchlists remain elevated, and the first keys are coming back to lenders. Despite all the issues we discussed above, we believe most participants in the apartment industry have been loath to recognize that cap rates have moved up 50-100 basis points and are unlikely to change anytime soon. Until they do, the transaction market stays somewhat frozen.
–
The REITs, however, are in a prime position to take advantage: buying what the private side has to sell, being first to initiate building when conditions warrant, and being opportunistic by adding scale through consolidation while they wait. Simply put, their shares are priced for the last three years rather than the next. But headlines will get worse before they get better, cap rates and NAVs still need to adjust to their new reality, and the buying doesn’t start until the bid-ask spread closes, which we acknowledge could take some time. We were right on supply and overweight while it worked, early on rents and have drifted towards a more neutral stance since, and 2027 looks like the year fundamentals turn. On the road to 2031, we believe the apartment REITs’ share of the market will look very different from the 2.3% of today.
–
Isaac A. Shrand, CFA
ishrand@chiltoncapital.com
(713) 243-3219
Matthew R. Werner, CFA
mwerner@chiltoncapital.com
(713) 243-3234
Bruce G. Garrison, CFA
bgarrison@chiltoncapital.com
(713) 243-3233
Thomas P. Murphy, CFA
tmurphy@chiltoncapital.com
(713) 243-3211
–
VNQ: $89.63 (9.30.2026) vs. $88.49 (12.31.2025) vs. $116.01 (12.31.2021) vs. $56.91 (3.23.2020)
–
An investment cannot be made directly in an index. The funds consist of securities which vary significantly from those in the benchmark indexes listed above and performance calculation methods may not be entirely comparable. Accordingly, comparing results shown to those of such indexes may be of limited use.
The information contained herein should be considered to be current only as of the date indicated, and we do not undertake any obligation to update the information contained herein in light of later circumstances or events. This publication may contain forward-looking statements and projections that are based on the current beliefs and assumptions of Chilton Capital Management and on information currently available that we believe to be reasonable, however, such statements necessarily involve risks, uncertainties and assumptions, and prospective investors may not put undue reliance on any of these statements. This communication is provided for informational purposes only and does not constitute an offer or a solicitation to buy, hold, or sell an interest in any Chilton investment or any other security. Past performance does not guarantee future results.
Information contained herein is derived from and based upon data licensed from one or more unaffiliated third parties, such as Bloomberg L.P. The data contained herein is not guaranteed as to its accuracy or completeness and no warranties are made with respect to results obtained from its use. While every effort is made to provide reports free from errors, they are derived from data received from one or more third parties and, as a result, complete accuracy cannot be guaranteed.
Index and ETF performances [RMZ, VNQ, and FNER] are presented as benchmarks for reference only and do not imply any portfolio will achieve similar returns, volatility or any characteristics similar to any actual portfolio. The composition of a benchmark index may not reflect the manner in which any is constructed in relation to expected or achieved returns, investment holdings, sectors, correlations, concentrations or tracking error targets, all of which are subject to change over time.


