
Portfolio Insight | 2ND Quarter 2026
The S&P 500 staged a steep rally in the second quarter following Iran-war-induced weakness in the first quarter. Fears regarding the ultimate duration and impacts of the war on global inflation and growth subsided in April. Ceasefires emerged, and the market advanced 15.2% for the period with steady gains in April and May before dropping very slightly in June. The first half 2026 return was +10.2%.
In the second quarter, the strongest sectors were Information Technology, Industrials, and Consumer Discretionary, while Energy, Utilities, and Consumer Staples lagged the most. Shockingly, Information Technology was the only sector to outperform the index in 2Q. Year-to-date, Industrials, Information Technology, and Energy have outperformed the most while Financials, Consumer Discretionary, and Communication Services have lagged the most. Mega-cap growth stocks performed well through mid-May but rolled hard into quarter end, largely due to renewed concerns around AI spending. Market breadth has recently improved, typically a positive indicator for further market gains.
A Strong Bounce
Fighting in the Middle East peaked, as the US and Iran signed a shaky MOU to reopen the Strait of Hormuz and negotiate during a 60-day ceasefire. This led to the market rebounding nicely.
The rebound has been healthy, driven by remarkably strong, broad-based reported earnings and future earnings growth estimates which have been revised significantly higher for this and the next several years. And, it’s not just Information Technology/AI stocks driving the gains. As shown in the table below, every sector except for Health Care is currently expected to see greater EPS growth this year than was expected as of March 31st. This fact may be surprising to some considering the Iran war has moved inflation higher and virtually eliminated the prospects for potentially economy-boosting rate cuts from the Federal Reserve.
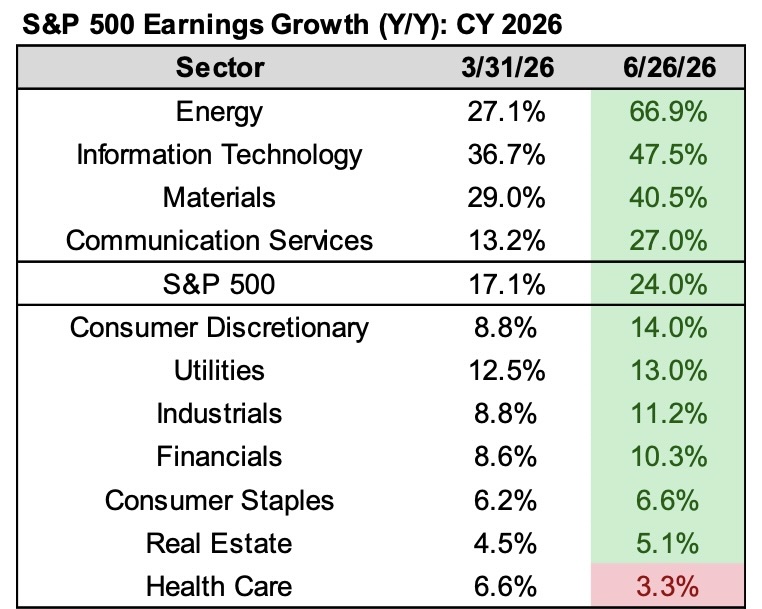
Source: FactSet Earnings Insight
AI Boom vs. Internet Boom
The S&P 500 is currently just 1% below its all-time high and has seen a substantial move higher since the end of 2022. With AI still a major driving force behind the economy, earnings growth, and market action, some observers continue to wonder if we’re in an AI “bubble” that will end similarly to the Internet boom.
However, in the first chart on the next page, we can see that the gains of recent years have been driven entirely by spectacular earnings growth, which we expect to continue for several years. The forward P/E multiple of the index has actually contracted by 9% since 2021, suggesting the market is not currently overvalued.
Contrast that with the second chart showing gains during the 1995-2000 Internet boom. In that period, gains were fueled by an unsustainable 3.2-fold move higher in growth stock multiples, while EPS only grew by 25% between 1995 and 1999. The stark difference between the two periods suggests that, rather than a bubble, we are still in the early years of a long AI cycle.
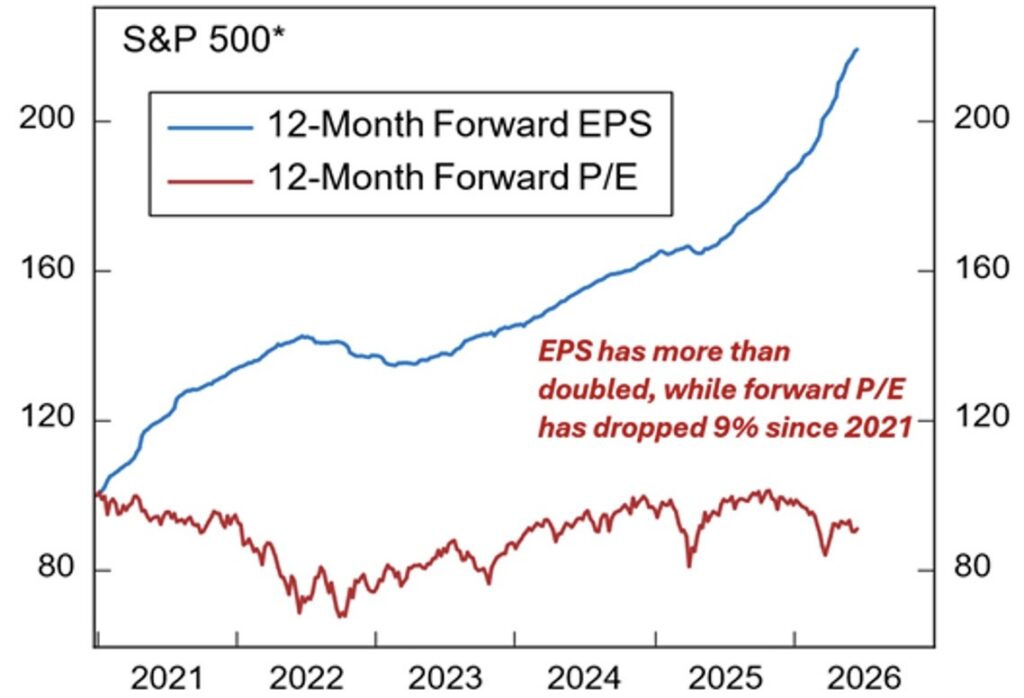
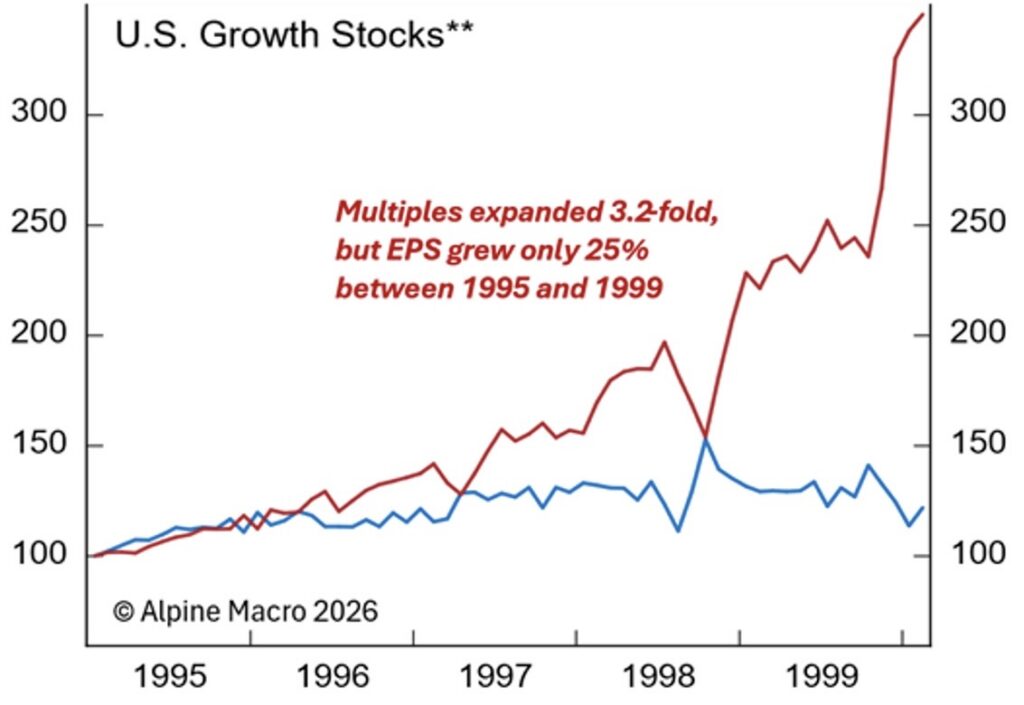
*Rebased to Jan 2021=100, **Rebased to Jan 1995=100
Spectacular SpaceX IPO
SpaceX (SPCX), founded by Elon Musk in 2002, broke a multi-year initial public offering (IPO) drought with a blockbuster offering on June 12th. With its rockets, AI, and Starlink divisions boasting massive profit potential, SpaceX has the capacity to become the most influential company in the world though it is currently losing money due to heavy investment in the rocket and AI divisions.
This company debuted with a market cap of $1.7 trillion ($135/share), which rose to nearly $3 trillion before recently dropping to near $2 trillion ($171/share). To put this in perspective, the world’s current largest companies include highly profitable NVIDIA at close to $5 trillion, Apple and Alphabet near $4 trillion, and Microsoft near $3 trillion. Though its market cap is large, only $75 billion of SPCX stock was sold to the public. More shares will be offered over time, and it is certainly a company we are following closely.
Domestic Equity Outlook
The corporate earnings outlook was strong before the war and has only strengthened since its apparent end. Falling oil prices should be a tailwind to energy-sensitive equities. The major negative development in the first half was the uptick in inflation. With the job market stable, rising inflation means the Federal Reserve must now consider rate hikes, not cuts. The inhibitive effect of higher rates implies a lower multiple on forward returns. However, even at a lower multiple, the strength of next year’s earnings outlook suggests 2026 market returns could still move higher from current levels, possibly into low double-digits.
Meanwhile, violent rotation has occurred within the market. The Mag 7 are suddenly lagging the index, and risk factors such as high beta, momentum, and volatility have undergone historic moves. It is likely these factors will revert to normal at some point, but timing and magnitude are unknown. Our individual stock price targets suggest Chilton equity portfolios have further upside and should benefit when these factor extremes normalize.
Fixed Income Outlook
Despite the headwind of higher interest rates, the bond market advanced in 2Q. After a slightly negative 1Q, the Bloomberg US Aggregate Index, a mix of government and corporate bonds, is now positive year-to-date with a return of 0.62%. 10-Year Treasury yields rose from 4.30% to 4.44% during the quarter, while 2-Year Treasuries, which are more influenced by Federal Reserve policy, moved from 3.79% to 4.14%.
The rise in interest rates is highly correlated to the spike in energy prices resulting from the conflict in Iran. Higher energy prices have begun to appear in inflation metrics which have moved the Federal Reserve from a posture of potentially cutting interest rates to possibly raising them. Markets are currently pricing in one 0.25% hike later this year and another in the first half of 2027. Rising interest rates generally depress demand, and new Fed Chair Kevin Warsh made clear during his first press conference that the committee is comfortable with the health of the US economy and labor market, and ready to aggressively tackle inflation. The unemployment rate remains relatively low at 4.3%, and GDP is poised to accelerate throughout the year,
buoyed by not just AI-related capital expenditures, but also remarkably steady consumer spending. Markets were also relieved that Chair Warsh signaled he would not be swayed by President Trump’s vocal push for lower interest rates. Calling Fed independence into question could trigger longer term inflation fears, and ultimately, higher interest rates. As it stands today, market participants have increased confidence that the Fed will tame this current bout of inflation. This is reflected in longer term inflation expectations (derived from Treasury Inflation Protected Bonds).
Most bonds we buy (typically investment grade maturing in 1-7 years) are bought with the intention of being held to maturity and yield between 4.25% and 4.75%. At these levels, we feel bonds represent good values for those clients with fixed income allocations.
Global Markets Outlook
Global equities have been resilient through war-related volatility, higher oil prices, and less supportive rate policies in the first half of 2026. Emerging markets have led, advancing 24% year-to-date, while US small caps are up nearly 23%. US large caps and international developed markets have trailed those more volatile areas, though both are still up roughly 10%. Encouragingly, these gains have been supported primarily by improving earnings, not an expansion in valuation multiples.
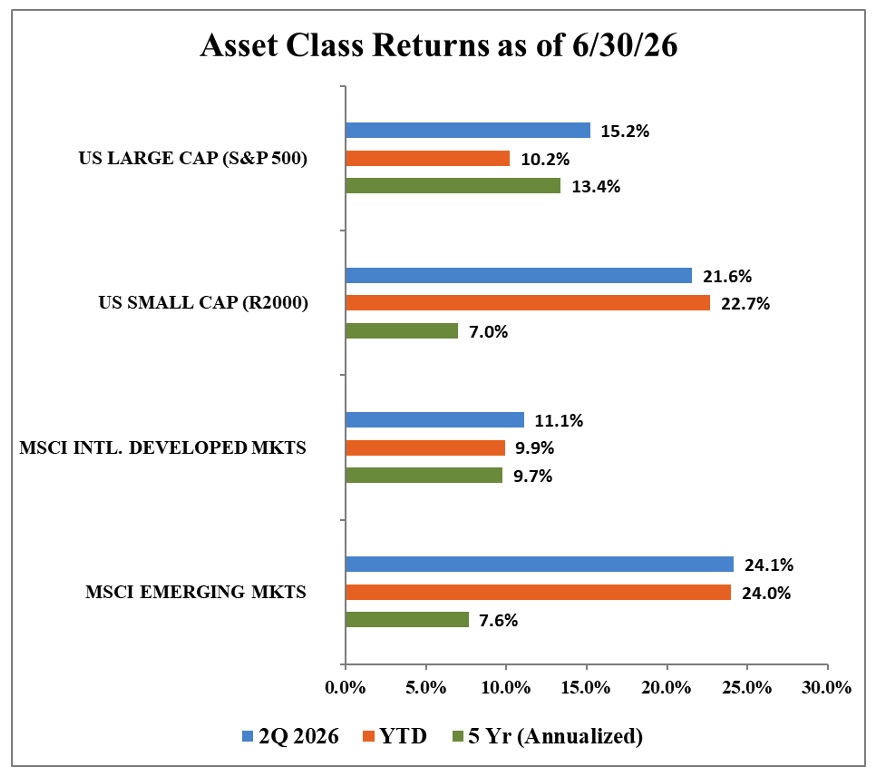
Source: Bloomberg, Chilton Capital Management
It may surprise some readers that Taiwan, despite its relatively small population, is now the country with the largest weight in the MSCI Emerging Markets Index at
26%, followed by Korea at 23% and China at 20% as of the end of May. Taiwan’s rise reflects its critical role in the AI supply chain, especially through Taiwan Semiconductor, which has become one of the world’s most important companies. Korea’s strength is more tied to the memory cycle, particularly through SK Hynix and Samsung, with high-bandwidth memory emerging as an important AI-related growth driver. This has helped drive extraordinary year-to-date returns, with Taiwan up roughly 70% and Korea more than doubling.
That concentration cuts both ways. Taiwan Semiconductor alone accounts for more than 14% of the overall emerging markets index, while Samsung and SK Hynix together represent 14%. These companies have been major tailwinds for returns, but they also accentuate emerging markets exposure to the AI cycle and semiconductor volatility.
Outside of emerging markets, performance has been positive but mixed. US small caps have benefited from a broader risk-on environment, strength in energy and industrials, and the outperformance of more volatile stocks. International developed markets have trailed, in part because they have less direct AI exposure and slower earnings growth. Still, the Eurozone has begun to improve after several years of weak earnings, helped by financials, energy, tech, and fiscal support.
The currency backdrop also bears watching. Last quarter, the US dollar strengthened as investors sought safety during the initial phase of the Iran conflict. The dollar has moved higher again recently, but not yet with the kind of sustained, disorderly rally that would create a major headwind for global equities. A sharply stronger dollar would pressure non-US assets and tighten financial conditions for emerging markets. For now, the dollar is a risk to monitor, but not one that has overwhelmed the broader global earnings story.
Additional risks include the potential for renewed Middle East fighting, another oil spike, or global central banks remaining tighter for longer than markets expect. As it stands though, oil prices have started to move lower, global earnings are improving, and the AI buildout continues. While recognizing that they have become more tied to the AI cycle, we remain constructive on global markets overall.
REIT Commentary
In the second quarter of 2026, the Vanguard Real Estate ETF (VNQ) produced a total return of +9.7%. Following the March volatility due to draconian AI concerns and the war in Iran, 2Q marked a refocus on fundamental strength in spite of rising inflation. Notably, while initial 2026 guidance felt weak on the 4Q earnings calls, 1Q earnings season was a clear indication of favorable supply and demand trends across all property types. Thus, the year-to-date total return of +11.1% for VNQ feels justified given rising earnings estimates and expectations for further acceleration in 2027/2028.
The volatility in the market in February and March was largely driven by an article penned by Citrini Research called “The 2028 Global Intelligence Crisis.” It portrayed a dystopian scenario where AI replacement leads to a doom loop, pushing the unemployment rate above 10%. This affected multiple sectors in the market – most notably software – but within REITs it had the strongest effect on office REITs, which would face increased obsolescence in such a dystopian scenario.
From December 31, 2025 to March 27, 2026, the FTSE NAREIT Equity Sub Sector Office REIT Index (FNOFFTR) produced a total return of -19.5%, which compared to the VNQ at -0.6% over the same period. We had discussions with REIT management teams and analysts to determine that the valuation did not reflect the decisions that were being made by tenants. BXP, Inc. (BXP) had its best year of leasing in 2025 since 2019, and has preleased 56% of 343 Madison, a $2 billion class A+ trophy office development connected to Grand Central in New York City. Tenants have been eager to secure space in the building, signing 15-20 year leases for space that will not be available until late-2029. We concede that AI will be a disruptive technology, which can create winners and losers as well as accelerate obsolescence in non-premier office buildings. However, our conviction that premier workspaces in high quality locations will become increasingly relevant has only strengthened.
As such, we increased our office exposure in the pullback from 4.6% on January 31, 2026 to 7.7% on March 31, 2026, making office one of our larger overweights (compared to 2.7% office allocation in VNQ). From March 27 to June 30, 2026, the FNOFFTR produced a total return of +39.6%, which compared to +11.8% for the VNQ, making it the top-performing sector. This is yet another example where the volatility in the market due to headlines can create opportunities for active managers to produce outperformance.
We have also been benefiting directly from AI spending through our allocation to the data center REIT sector, which is an overweight in the portfolio. After ranking near the bottom of 2025 sector returns, the FTSE NAREIT Equity Sub Sector Data Centers Total Return Index (FNDCTR) produced a +33.2% total return in 2026 through June 30. We have not trimmed exposure through the period of outperformance; in fact, we added a new data center name in the quarter: Blackstone Digital Realty (BXDC), the largest blind pool IPO ever done by a REIT. BXDC plans to invest the cash in stabilized data centers that are leased to hyperscale tenants with 15-20 year maturities, a differentiated strategy amongst the other public players.
Outside of data centers – and to a lesser extent cell towers and industrial which should also have direct benefits from AI – we believe REITs are mostly immune to the potential disruption as a result of AI. Therefore, we believe REITs fit perfectly in the HALO theme (Heavy Assets, Low Obsolescence) that should provide a safe haven amidst the noise that is whipsawing the markets in 2026.
Bradley J. Eixmann, CFA
Brandon J. Frank
Robert J. Greenberg, CFA
Matthew R. Werner, CFA
The information contained herein should be considered to be current only as of the date indicated, and we do not undertake any obligation to update the information contained herein in light of later circumstances or events. This publication may contain forward looking statements and projections that are based on the current beliefs and assumptions of Chilton Capital Management LLC and on information currently available that we believe to be reasonable, however, such statements necessarily involve risks, uncertainties and assumptions, and prospective investors may not put undue reliance on any of these statements. This communication is provided for informational purposes only and does not constitute an offer or a solicitation to buy, hold, or sell an interest in any Chilton Capital Management investment or any other security. The S&P 500, the Bloomberg US Aggregate, the MSCI US REIT, and the FTSE NAREIT All Equity REIT indices are presented as benchmarks for reference only and does not imply any portfolio will achieve similar returns, volatility or any characteristics similar to any actual portfolio. The composition of these indexes may not reflect the manner in which any is constructed in relation to expected or achieved returns, investment holdings, sectors, correlations, concentrations or tracking error targets, all of which are subject to change over time.


