
REIT Commentary | Second Quarter 2026
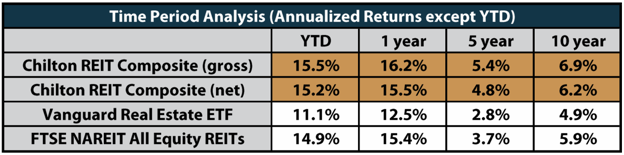
In the second quarter, the Chilton REIT Composite outperformed the VNQ by producing a total return of +11.8% gross of fees and +11.6% net of fees, which compares to the VNQ’s total return of +9.7%. Year to date, the Chilton REIT Composite has outperformed the VNQ by producing a total return of +15.5% gross of fees and +15.2% net of fees, which compares to the VNQ’s total return of +11.1%. See the table on page 2 for historical numbers.
–
2Q26 Attribution Relative to VNQ
Positive contributors to relative performance for the second quarter included stock selection within the triple net sector, an underweight allocation to the real estate services sector, and an overweight allocation to the office sector. Conversely, detractors from relative performance included an underweight allocation to the lodging sector, and stock selection within the residential and data center sectors.
–
YTD Attribution Relative to VNQ
Positive contributors to relative performance for the first half of 2026 included an underweight allocation to the real estate services sector, and selection within the shopping center and triple net sectors. Conversely, stock selection within the residential sector, and an underweight allocation to the lodging and regional mall sectors detracted from relative performance.
–
2026 Contributors Summary
- An underweight allocation to the real estate services sector contributed to relative performance. The group has been pressured by fears that AI could replace the brokerage business. While we believe these fears are becoming overblown, we admit is challenging to envision the future of this business at the current juncture. We remain on the side lines but are looking closer at the group given the pullback.
–
- Stock selection within the shopping center sector also contributed to relative performance. Notably, our overweight position in Whitestone REIT (NYSE: WSR), which has benefitted from a takeout announced in April, contributed to Composite relative performance.
–
- Stock selection within the triple net sector also contributed to relative performance. Notably, our overweight position in Frontview REIT (NYSE: FVR), has meaningfully outperformed the group and contributed to Composite relative performance.
–
2026 Detractors Summary
- Stock selection within the residential sector also detracted from relative performance. In particular, our early year overweight exposure to single family rentals (SFRs) was negatively impacted by the Senate proposal banning institutional owners from growing in the space. While the bill is currently stalled on President Trump’s desk, we have exited the space and expect the political overhang to remain.
–
- An underweight allocation to the lodging sector detracted from the Composite’s relative performance. Specifically, the group has performed well in 2026 despite some challenges facing the consumer.
–
- An underweight allocation to the regional mall sector also detracted from relative performance. Notably, while we maintain a modest position in Simon Property Group (NYSE: SPG), we have focused our retail exposure in the open-air shopping center names.
–
Market Commentary
REITs: A Defensive HALO Against AI Obsolescence | May 2026
An Overdue Benchmark Change: RMZ to VNQ | June 2026
Equity REITs: Takeaways from REITWeek 2026 | July 2026
–
–
Additional Disclosures
Past performance is not indicative of future results. Investment returns and principal value will fluctuate so that an investor account, when redeemed, may be worth more or less than their original cost. Current performance may be lower or higher than the performance data quoted. Vanguard Real Estate ETF and FTSE NAREIT All Equity REITs Index performance is presented as a benchmark for reference only and does not imply any portfolio will achieve similar returns, volatility or any characteristics similar to any actual portfolio. The composition of a benchmark index may not reflect the manner in which any is constructed in relation to expected or achieved returns, investment holdings, sectors, correlations, concentrations or tracking error targets, all of which are subject to change over time.
The information contained herein should be considered to be current only as of the date indicated, and we do not undertake any obligation to update the information contained herein in light of later circumstances or events. This publication may contain forward looking statements and projections that are based on the current beliefs and assumptions of Chilton Capital Management and on information currently available that we believe to be reasonable, however, such statements necessarily involve risks, uncertainties and assumptions, and prospective investors may not put undue reliance on any of these statements. This communication is provided for informational purposes only and does not constitute an offer or a solicitation to buy, hold, or sell an interest in any Chilton Capital Management investment or any other security.


