
2024 Chilton REIT Forecast | January 2024
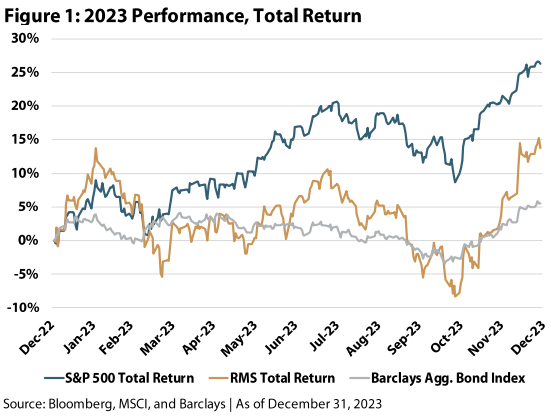
2023 could be described as nothing short of a rollercoaster, as shown in Figure 1. Our 2023 total return forecast of +8% to +12% ended up being too low relative to the actual calendar year total return of +13.7%, in spite of mid-year prices on the MSCI US REIT Index (Bloomberg: RMZ) falling to levels that we had reached as far back as April 2013 (a “lost decade” of price return).
–
–
In general, headlines were negative for real estate throughout the year, either through a lack of return to office, busted multi-family deals, debt defaults, private REITs restricting investor withdrawal activity, and higher interest rates. Going into 2023, the market had anticipated only two interest rate hikes and that the Fed would be ‘done’ by March. Instead, we got four hikes, and the Fed didn’t ‘pause’ until September. Ultimately, the market capitulated, and, as of October 27, 2023, the RMZ (price-only) was down 11.3% for the year, and off 35.5% from the all-time high on December 31, 2021.
–
After several new data points in October and November, it appears as the Fed is finally ‘done’, which has caused REITs to rally +22.8% from October 27th to the end of the year (as measured by the RMZ price-only index), signaling a swift but warranted change in price and monetary policy. Even so, as of December 31, 2023, the RMZ remains 20.8% off its all-time high.
–
Going into 2024, the Fed is potentially done hiking interest rates, and the market is expecting six interest rate cuts for the calendar year. Though we also anticipate interest rate reductions at the short end of the curve, we do not assume a decline in the 10-year Treasury yield in our total return projection. Using a combination of adjusted funds from operations (or AFFO) growth, net asset value (or NAV) growth, and dividend growth, we forecast a total return of 12% to 16% for the RMZ in 2024. Looking further out, we historically have expected 6-8% long term average total returns. However, as interest headwinds abate, we have nudged our longer-term expectations up to 7% to 9%, even after our expectations for an above normal return in 2024.
–
2023 In Review
Due to the startling reversal starting on October 27, we summarize 2023 in two separate periods. In the first period, the Fed continued the quickest rate hike cycle in history, driving the 10-year Treasury yield from 3.88% on January 1, 2023 to 4.99% on October 18, the highest since 2007. During the year-to-date period through October 27, the RMZ produced a total return of -8.3%, bringing the peak (12/31/21) to trough price change to -35.5%. The FTSE NAREIT All Equity REITs Index (Bloomberg: FNER), a similar index with a track record back to 1972, experienced a similar drawdown, which ranked as the third largest in history. The period was characterized by strong job growth, decelerating but elevated inflation, and persistently positive retail sales. Notably, the Barclays Aggregate Bond Index (Bloomberg: LBUSTRUU) produced a total return of -2.5% during this period, also underperforming the S&P 500.
–
Following October 27, the 10-year Treasury yield fell from 4.85% to finish the year at 3.87%. During this period, the RMZ produced a total return of +24.1%, and some office REITs rallied +50% to +100%. This period was characterized by slowing retail sales, decelerating but positive job growth, and several inflation prints that trended toward the Fed’s stated goal of 2%.
–
We had been awaiting this shift in policy, called the Fed ‘pivot’, and had been making changes to the portfolio to prepare for the change. The outperformance of the Chilton REIT Composite in the first period of the year can be attributed to our tilt toward quality balance sheets and cash flow growth. However, we began to shift the portfolio in the summer toward slow growth, high yield opportunities that had been relative underperformers for the year. This strategy worked well, as the Chilton REIT Composite was able to finish the year with positive alpha in spite of underweights to the office and mall sectors, two of the top three performers from October 27 to December 31, 2023.
–
–
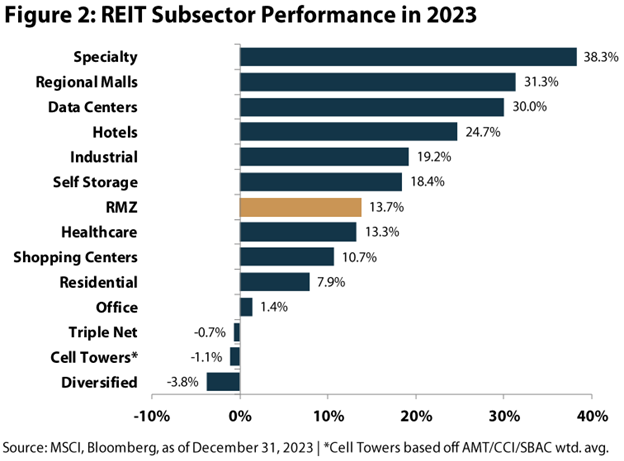
Within the REIT sector, there was significant dispersion among the top and bottom REIT subsectors, as shown in Figure 2. Specialty (+38.3%), Regional Malls (+31.3%), and Data Centers (+30.0%) led the way, while Diversified (-3.8%), Cell Towers (-1.1%), and Triple Net (-0.7%) lagged, further demonstrating the continued importance of active management.
–
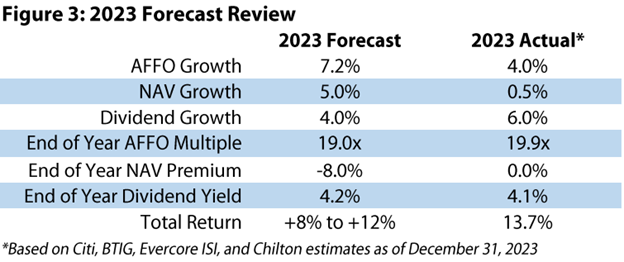
Revisiting our forecast for 2023, and as shown below in Figure 3, we had projected NAV growth of +5.0%, AFFO growth of +7.2%, and dividend growth of +4.0%. As of this publication, the estimates for actual growth in these factors was +0.5%, +4.0%, and +6.0%, respectively. We estimated an end of year AFFO multiple of 19.0x, NAV premium of -8.0%, and dividend yield of 4.2%. The actual estimates turned out to be 19.9x, 0.0%, and 4.1%, respectively. We had projected the 10-year Treasury yield to be flat with the start of the year at 3.5%, which got surprisingly close after seeming out of reach for most of the year. In summary, the rapid increase in the 10-year Treasury yield had a larger than anticipated impact on REIT earnings and NAVs, but investors were able to look through the temporary disruption and apply a higher multiple and NAV premium in hopes of a more accommodative Fed in 2024 and 2025.
–
–
Bold Predictions for 2024
Before getting to the nuts and bolts behind the total return forecast, we have several ‘bold predictions’ that influenced some of our more subjective assumptions.
- Persistent NAV Premiums: In 2024 and beyond, we believe public REITs will be attractive to investors as a new real estate cycle takes hold with public REITs facing less competition. Having proven their safety in tumultuous times versus private real estate investments, more advisors and institutions will look to public REITs to provide income and growth, but with less leverage and a more attractive valuation. The ’free ride’ investors have enjoyed due to cap rate compression is over and should tilt the scales toward top notch managers and public REITs. Accordingly, we believe enough attributes exist with public REITs that should allow premiums to NAV to be the norm for a prolonged period, which will allow for accretive acquisitions.
–
–
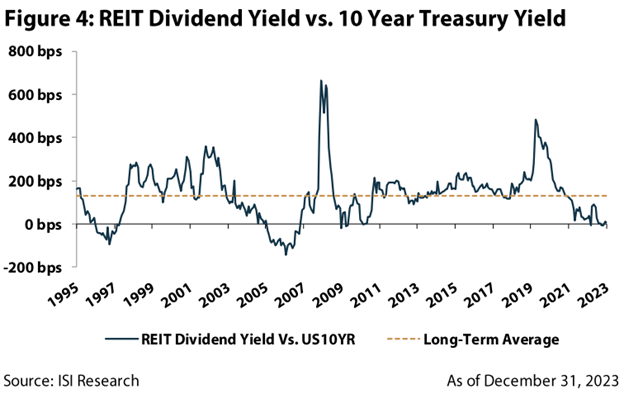
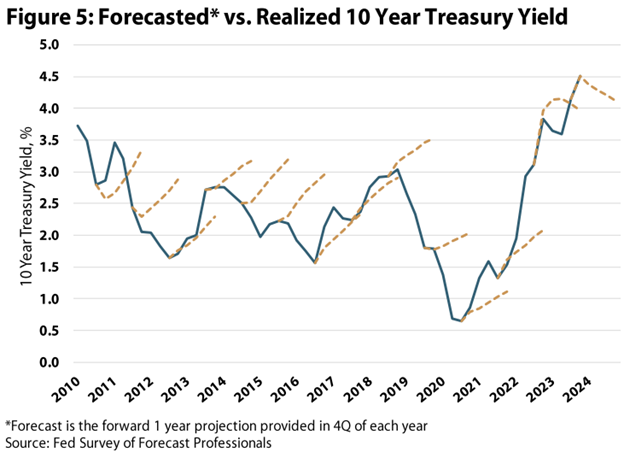
2. REIT Dividend Yield vs 10-year Treasury Yield Spread to Remain Below Historical Average: The historical average spread between the dividend yield and the 10-year Treasury yield is ~130 basis points, which compares to the spread of 8 bps, as of December 31, 2023 (Figure 4). While a return to the historical average spread would be detrimental to REIT prices, we believe the current environment is completely different than the past 13 years due primarily to how the Fed manipulated interest rates following the GFC. Figure 5 compares the Fed forecast for the 10-year Treasury yield (dotted line) at the start of each year against the actual realized yield (solid line). Based on the Fed’s survey of professional forecasters, the 10-year Treasury yield was estimated to rise roughly 50 bps each year between 2010 and 2022. However, 2023 and 2024 are markedly different. The initial forecast for 2023 called for an essentially flat 10-year Treasury yield, and the most recent forecast for 2024 estimates an almost 40 bps decline. We believe this difference in expectations is significant enough for the REIT dividend yield to 10-year Treasury spread to remain below its historical average, or possibly even decline further.
–
–
In addition to these two bold predictions, we have several other ‘fun’ predictions:
–
3. Public REITs outperform S&P 500, Barclays Aggregate Bond Index, and private real estate (as represented by the NFI-ODCE)
4. Public REITs become ‘lenders of last resort’ to embattled private real estate owners with upcoming debt maturities
5. Positive fund flows into both active and passive REIT funds
6. The median REIT mutual fund outperforms the RMZ
7. Three or more REIT IPOs
8. One or more private real estate vehicles sells an asset or portfolio to another vehicle with the same sponsor
9. Public REITs are net acquirers for the year, with some increasing in size by 20% or more
10. Merger activity accelerates in 2024, potentially surpassing the high-water mark set in 2021
–
2024 Forecast
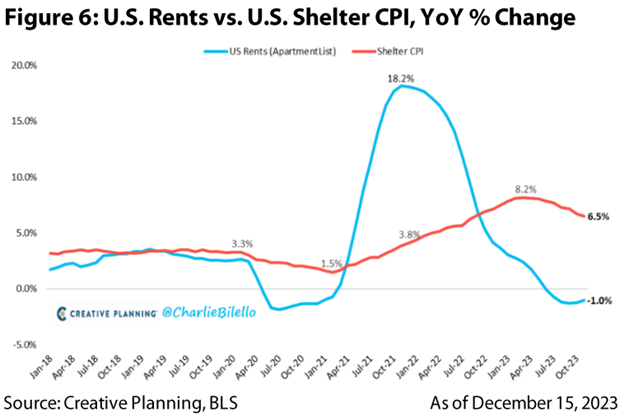
If we are right on even half of the bold predictions, then it should be a good year for REIT investors. Coming off of the most rapid increase in the Fed Funds rate of all time, it appears the Fed is going to be ‘data dependent’. And, as of December 31, 2023, the data is pointing to a deceleration of inflation toward the long-term goal of 2%. For November 2023, the year over year Consumer Price Index (or CPI) was up 3.1%, while the Core Personal Consumption Expenditures Index (or PCE) was up 3.2%. Note that housing costs make up approximately ~35% and ~15% of the CPI and Core PCE Indices, respectively, and we believe housing costs will become a headwind to inflation instead of a tailwind in 2024. This is due to the decline in market apartment rents and the slowdown in home price appreciation that takes approximately 6-12 months to work through the system, as shown in Figure 6.
–
–
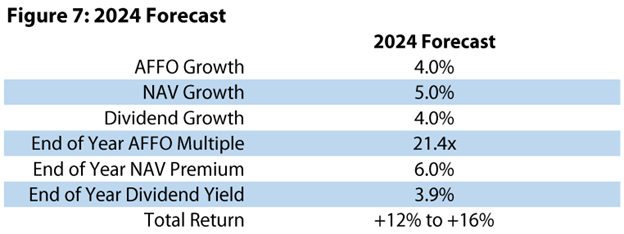
This, combined with recent retail sales, job creation, and Producer Price Index (or PPI) data should cause the Fed to begin cutting interest rates sometime in 2024. While the market consensus calls for six interest rate cuts starting in March, for the purpose of our analysis, we assume a flat 10-year Treasury yield. As we touched on in Bold Prediction #1, we believe REITs could trade at a premium to NAV for a prolonged period and, thus, we envision NAVs returning to prominence for REIT valuation in 2024. Therefore, contrary to last year’s outlook, we are utilizing NAV valuation as our primary forecasting tool for 2024, while AFFO and dividend growth are included as secondary comparisons. Highlighted in Figure 7, we project the current 0% NAV premium to improve to a 6% premium by the end of 2024. Further, we estimate underlying NAVs to grow by 5%, supported by 3% NOI growth and 10 bps of cap rate compression (external growth would generate even more upside). Combined, these assumptions produce an 11% price return for the REIT index, which alongside an expected 4% dividend yield implies a 15% total return outlook for REITs next year.
–
Turning to the AFFO framework, growth of 4% and a reasonable expansion (1.5 turns) from the current AFFO multiple supports a similar ~15% total return outlook. NAV premiums and strong balance sheets should provide a cost of capital advantage that allows public REITs to take advantage of dislocations in the private markets. In addition, the multiple relative to the S&P 500 is well below the recent averages. As such, we believe the gap will close slightly during the year.
–
Finally, we expect REIT dividends to grow by 4% and, given the specter of falling rather than rising interest rates, the REIT yield to moderate by roughly 20 bps. This results in price appreciation of 11%, which generates a total return of ~15% using the average dividend yield of ~4%.
–
Taking all three methodologies together, we forecast a 12% to 16% total return outlook for public REITs in 2024.
–
–
Risks to the Forecast
Our NOI growth, AFFO growth, and dividend growth forecasts assume that demand is steady, meaning job growth remains positive and the economy does not enter into a serious recession. In the case of a decline in economic activity, the Fed would presumably accelerate interest rate cuts, which could help real estate pricing, although top line growth assumptions would take a hit in some sectors. We believe that returns could still be positive in this scenario, but sectors such as retail, apartments, self-storage, and lodging would underperform our baseline assumption.
–
However, we believe risks are skewed to the upside. The recent increase in REIT equity prices could play out a scenario that we have been predicting for years; one in which public REITs are able to use their cost of capital advantage to increase market share through accretive acquisitions. We believe the ‘higher for longer’ interest rate scenario, while a slight headwind for earnings growth, could actually be a tailwind due to the external growth potential.
–
Over the past nine years, over $99 billion in capital has flowed away from public REIT ETF’s and mutual funds, while non-traded REITs have taken in $51 billion of capital in the past three years alone. This may have made sense when higher leverage would equate to a lower blended cost of capital, but the tables have turned. While non-traded REITs are having substantial net redemptions, a return to net inflows for public REITs would result in a premium to NAV that will allow them to make accretive acquisitions. The anticipation of future accretive acquisitions could increase earnings estimates, thereby justifying the premium to NAV, creating a positive feedback loop.
–
Furthermore, the cost of debt capital is very much in favor of public REITs today as evidenced by their ability to issue at ~150 bps lower spread than secured debt issuers (using REIT unsecured vs CMBS spreads as of December 15, 2023). In addition, private market participants, as reported by the ODCE index, have almost 20% of their debt coming due in 2024, while public REITs have only 6%, once again giving public REITs superior flexibility and lower risk. There are many similarities today with the start of the modern REIT era in the early 1990’s where good real estate held by private players needed an equity infusion to offset too much debt leverage, and the public market was the only store with an ‘OPEN’ sign.
–
Chilton Positioning
We believe the most attractive REITs have the ability to generate long term growth in AFFO and dividends, which we balance against our proprietary valuation models to build a portfolio with the best prospective risk-adjusted return. Over 80% of our holdings are in sectors with superb fundamentals characterized by high occupancy rates and rental growth. Based upon our proprietary analysis, we estimate weighted average dividend growth of at least 4% in 2024 and somewhat higher in 2025 as external growth becomes more of a factor for the Chilton REIT Composite holdings as of December 31, 2023.
–
In the past, we have used the term ’Essential’ to describe our stock selection process. Today, we believe ’Durable’ is a better identifier, as certain companies and property types have proven themselves in a 15-year period that had two of the worst real estate shocks in the past 50 years. This refers to both the predictability of long-term positive growth (due to property type and location) and the strength of balance sheet that provides a safe, growing dividend.
–
By property type, we would classify the most durable in descending order as Housing, Industrial, Cell Towers, Healthcare, Data Centers, and Shopping Centers. All of the REITs in the Chilton REIT Composite have low leverage that position them to take advantage of the distress underway with many private real estate owners that face looming debt maturities and lower valuations. Thus, we envision equity REITs should witness a significant boost from external growth as they act as consolidators from ’Zombie’ firms built on the zero-interest rate policy of the recent past. Equity REITs should be well-received now that ‘income’ has become embraced by more and more investors. Finally, 2023 is a good reminder to have a long-term perspective when investing in common stocks. Happy New Year!
–
Matthew R. Werner, CFA
mwerner@chiltoncapital.com
(713) 243- 3234
Bruce G. Garrison, CFA
bgarrison@chiltoncapital.com
(713) 243-3233
Thomas P. Murphy, CFA
tmurphy@chiltoncapital.com
(713) 243-3211
Isaac A. Shrand, CFA
ishrand@chiltoncapital.com
(713) 243-3219
–
RMS: 2,727 (12.31.2023) vs. 2,398 (12.31.2022) vs. 3,177 (12.31.2021) vs 1,433 (3.23.2020) and 2,560 (2.21.2020)
An investment cannot be made directly in an index. The funds consist of securities which vary significantly from those in the benchmark indexes listed above and performance calculation methods may not be entirely comparable. Accordingly, comparing results shown to those of such indexes may be of limited use.)
The information contained herein should be considered to be current only as of the date indicated, and we do not undertake any obligation to update the information contained herein in light of later circumstances or events. This publication may contain forward looking statements and projections that are based on the current beliefs and assumptions of Chilton Capital Management and on information currently available that we believe to be reasonable, however, such statements necessarily involve risks, uncertainties and assumptions, and prospective investors may not put undue reliance on any of these statements. This communication is provided for informational purposes only and does not constitute an offer or a solicitation to buy, hold, or sell an interest in any Chilton investment or any other security. Past performance does not guarantee future results.
Information contained herein is derived from and based upon data licensed from one or more unaffiliated third parties, such as Bloomberg L.P. The data contained herein is not guaranteed as to its accuracy or completeness and no warranties are made with respect to results obtained from its use. While every effort is made to provide reports free from errors, they are derived from data received from one or more third parties and, as a result, complete accuracy cannot be guaranteed.
Index and ETF performances [MSCI and VNQ and FNER and LBUSTRUU] are presented as a benchmark for reference only and does not imply any portfolio will achieve similar returns, volatility or any characteristics similar to any actual portfolio. The composition of a benchmark index may not reflect the manner in which any is constructed in relation to expected or achieved returns, investment holdings, sectors, correlations, concentrations or tracking error targets, all of which are subject to change over time.


