All Yield is Not Created Equal | September 2022
Over the past 40 years, due in part to actions by the Federal Reserve, Americans have become more and more obsessed with yield. Highlighted in Figure 1, after peaking at 15.8% in September 1981, the US 10 yr Treasury yield bottomed at 0.5% in August 2020. As intended, the lower ‘risk-free rate’ increased demand for yield assets, thereby increasing values. The higher valuations created household wealth, stimulated consumer spending, and enhanced GDP growth beyond what would’ve been if not for the Fed intervention.
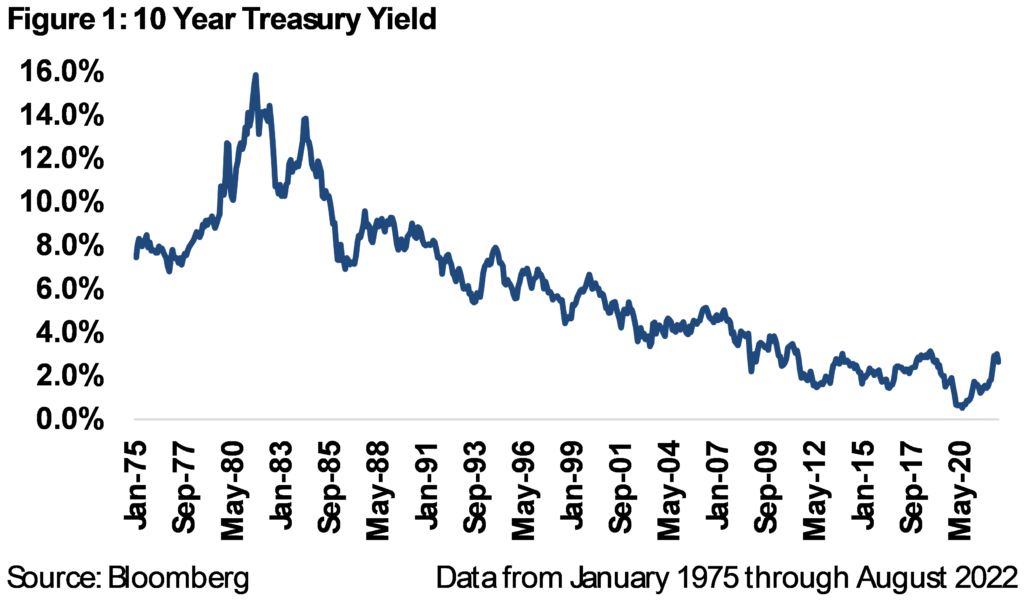
As yields moved lower, investors were ‘forced’ to look for alternative ways to get the same yield they previously were able to achieve with less risk. In our experience, securities with high yields have a unique ability to cause investors to look past some of the risks that would explain why the yield is so high.
In contrast to being yield-focused, the Chilton REIT Composite is focused on total return. In other words, we are indifferent to receiving a portion of the return in the form of dividends or in price appreciation. In addition, we adjust the expected total return for risk, optimizing for risk-adjusted total returns. As a result, the Chilton REIT Composite has produced an annualized total return of +10.0% gross of fees (9.1% net of fees) since inception on January 1, 2005 through August 31, 2022, which compares to the MSCI US REIT Index (Bloomberg: RMZ) annualized total return of +7.1% over the same period. Furthermore, this was achieved with less risk, and, not coincidentally, a lower dividend yield than the benchmark.
We believe our process of active management with a focus on risk-adjusted total returns provides investors the best opportunity for an adequate current yield with long term sustainable growth. In our opinion, if a yield appears to be too good to be true, it probably is!
A Little History
REITs had a somewhat uneventful start when they were passed into law in 1960. Even 30 years later, the market cap of all publicly traded equity REITs was only $5.6 billion as of December 31, 1990. This was all going to change due to a series of events in the 1980’s, and yield played a key role.
First, the Tax Reform Act of 1986 turned off the spigot of free flowing private capital, crippled traditional lenders, and caused the Fed to impose strict lending restrictions on real estate. The capital shortage pushed highly leveraged private real estate owners with limited options to save their companies by any means necessary. Wall Street finally had a wide open window to securitize real estate at scale.
The rush to securitize commercial real estate began in earnest in early 1992. While the market capitalization of all equity REITs was under $10 billion, these prospective public companies needed many times this amount. Due to the low profile of equity REITs for 30 years, both retail and institutional investors needed an education on the merits of investing in commercial real estate. Attracting interest ultimately necessitated a high dividend yield to investors, and as a result, payout ratios on Adjusted Funds from Operations (or AFFO, a measure of a REIT’s cash flow after capital expenditures) were routinely over 100% (but averaging close to 95%, as shown in Figure 2) and yields in the 8-10% range were common. By the end of 1997, there were 176 equity REITs with an equity market cap of $127.8 billion!
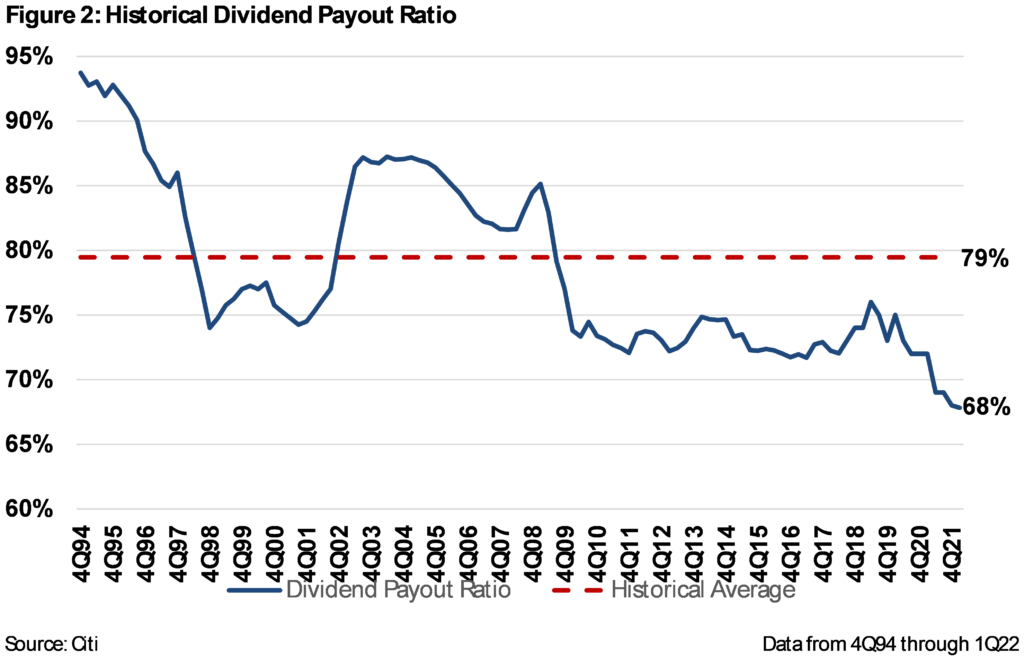
In time, it became apparent that the REITs were playing a dangerous game of using high dividend yields to attract equity capital…a game that works until it doesn’t. Fortunately, institutional influence from research analysts and rating agencies forced the industry to adjust their dividends to de-risk the chances of a dividend cut and reduce dependence upon the capital markets. The lessons learned in the 1990’s and 2000’s enabled the REIT industry to grow at a healthy pace, leading to an equity market cap for REITs of $1.5 trillion as of July 31, 2022.
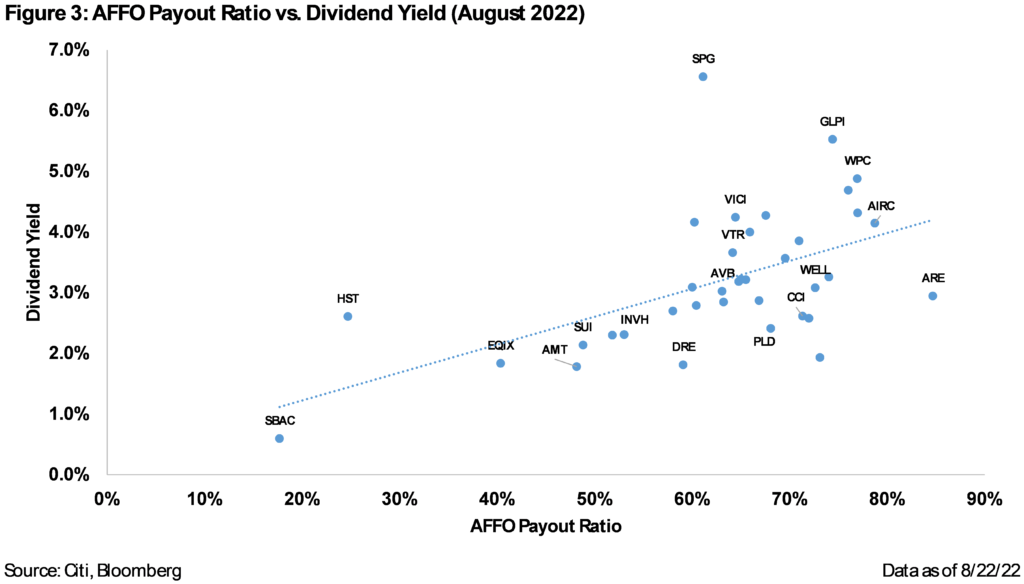
These companies have set the standard for how to run a sustainable REIT, while still providing investors with some yield. They proved a low dividend payout ratio was rewarded with a low dividend yield, affording them an attractive cost of capital as well as free cash flow to be used for external growth activities, internal development/redevelopment projects, debt pay downs, or stock buybacks. The chart in Figure 3 shows the positive correlation between dividend yield and payout ratio as of August 22nd, proving investors reward companies for less risky dividend yields while punishing company for high risk dividends.
Hard Lessons
While most REITs have learned from the experiences of the past, investors are still susceptible to the promise of a high yield, which creates opportunities for investments of all kinds to use yield to attract capital. To this day, the most common REITs that we are asked about by casual retail investors have high yields, and of course unbeknownst to them, high payout ratios, high leverage, and therefore high risk.
There are countless examples where a high stated yield and an investor propensity to reach for higher yield without concern for risk led allowed for fraud and scams to perpetuate. The original Ponzi scheme conducted by Charles Ponzi was only made possible because he promised a 50% interest rate that would be returned within 45 days, which compared to banks’ annual interest rates of ~5% in 1919-1920. Nearly 90 years later, less than a mile from our building in Houston we saw Allen Stanford taken in handcuffs for orchestrating a $7 billion fraud by promising interest rates 600-800 basis points (or bps) above other banks’ CD rates. When it comes to yield, history does seem destined to repeat itself.
A less-known example of this ‘game’ is the Japanese mutual fund market. The Japanese have an extreme obsession with yield, as their interest rates have hovered near zero since the early 2000’s. Mutual fund managers and distributors decided to prey on this by declaring extremely high dividends from their funds that had no basis on the yields of the underlying securities. For example, the two largest US REIT mutual funds in Japan – Shinko US REIT Fund (Bloomberg: 06311049 JP) and Fidelity US REIT Fund B (Bloomberg: 3231203C JP) – fabricated dividend yields of almost 25% during 2016, which compared to the average MSCI US REIT Index (Bloomberg: RMZ) dividend yield of 4.4% at the time. How was that possible? The funds were paying investors with their own money. Of course, this was disclosed in the annual filings, but the high yield had blinded investors from the truth. As a result, assets in Japanese registered REIT mutual funds ballooned from around $5 billion in 2009 to nearly $70 billion at their peak in 2016. After slightly lackluster returns in 2015 and 2016, the funds were finally forced to cut their dividends to a more reasonable level. The asset flows reversed, quickly taking total assets down to ~$30 billion by 2018.
Domestically, we have mentioned the non-traded REIT market in several of our REIT outlooks. Most of the time, they are preying on this same behavioral finance bias. The promise of a 5-6% annual yield and a market price that should only move up and down slightly on a quarterly basis gives the appearance of low risk and thus investors are lulled into thinking it is as safe as a fixed income investment! Again, upon inspecting the 10-K’s, payout ratios for all non-traded REITs we have seen are above 100% of AFFO. This model works while capital is coming in, but as we’ve seen time and time again, the model doesn’t work when redemptions outpace contributions. We are happy to hear that the North American Securities Administrators Association is considering new policies that would limit how much someone can invest in non-traded REITs, providing some protection for those who are not able to protect themselves from the inevitable collapse.
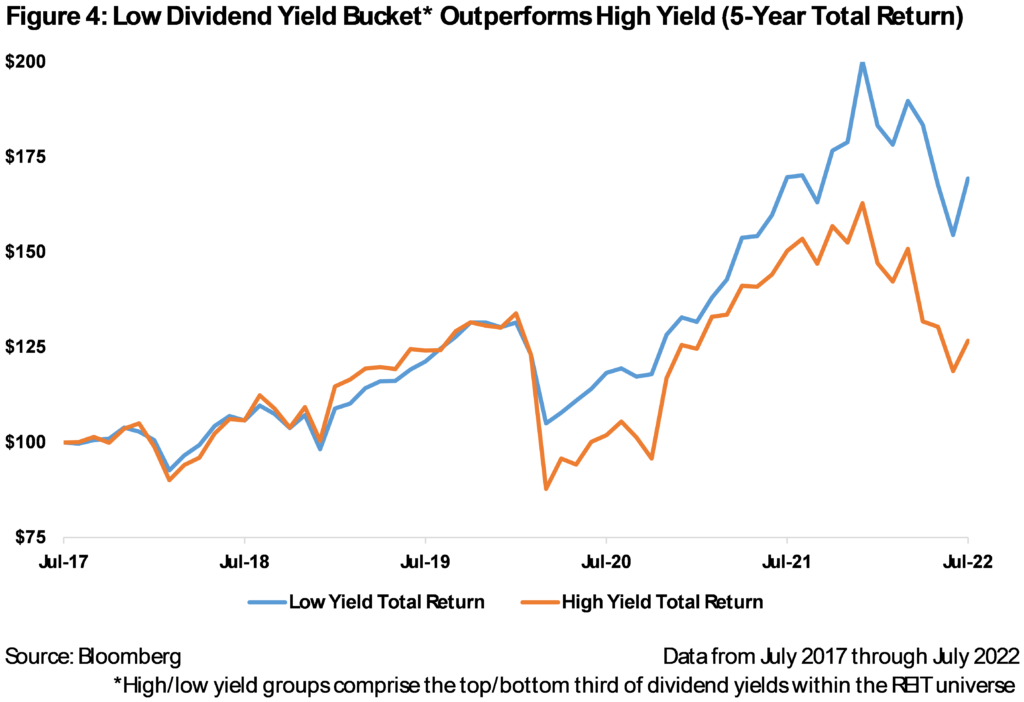
While there is a minimum dividend to fulfill the requirement to file as a REIT, there is no maximum. Within the publicly traded REIT universe, the performance track record by dividend policy speaks for itself. As shown in Figure 4, the top third of REITs ranked by yield have underperformed the bottom third by almost 4,300 basis points since August 2017. In addition to underperforming, high yield REITs had on average, higher leverage, higher stock volatility, higher payout ratios, and lower FFO growth…hey, but at least the investors collected a higher dividend!
The ‘Good’ Kind of Dividends
There are several theories in behavioral finance that explain the attraction to yield, but we think the ‘bird in the hand’ theory is the easiest to understand. The prospect that a company is going to pay cash to an investor generates a feeling of lower risk, as the investor is getting a portion of the anticipated return without having to sell the stock. Unfortunately, many investors get a false sense of security that this will continue indefinitely into the future.
This doesn’t mean that dividends are ‘bad’, however. In fact, they are extremely useful to our investment process, though not in the way that some may think. First, the ‘bird in the hand’ theory has mathematically proven benefits. According to the John Burr Williams 1938 book ‘The Theory of Investment Value’, cash received today is more valuable than cash in the future. He laid out the formula for a ‘discounted cash flow’ to value a company based on all of its future cash flows. He also popularized the ‘dividend discount model’, which had the same premise using dividends (or interest payments) to investors, instead of cash flows to the company. Therefore, getting some portion of the return in cash earlier does lower the risk slightly. Specific to REIT investors, the dividends also have tax benefits, as they have recently been comprised of 70% section 199a dividend income (20% discount to ordinary income tax rate), 20% long term capital gains (23.8% tax rate at the highest bracket), and 10% return of capital (0% tax rate).
Second, and more subjectively, we can use a company’s dividend track record to assess its capital allocation skill. A company that has had to cut the dividend at a slight economic downturn or has a reduced access to capital due to a heavy dividend burden would garner a discount using our target price methodology. In contrast, companies with consistent dividend track records of long term growth and few cuts, if any, receive a premium.
Notably, the Chilton process of assigning a premium or discount based on payout ratio, management track record, and leverage worked extremely well in 2020. While over 63 REITs were forced to cut or suspend their dividends, only one REIT in the Chilton REIT Composite had to do so. That company, Alexander Baldwin (NYSE: ALEX), is one of the few companies that cut its dividend that has since raised it above 2019 levels.
Ideal Dividend Policy
We believe REITs should average an AFFO payout of 80% or less over a full cycle, unless there are special circumstances. Companies should prioritize paying down debt until leverage is below 35% before increasing the dividend. Special dividends should be avoided, except in situations where the tax burden of holding cash from a property sale is prohibitive. Companies should feel comfortable increasing payout ratios from today’s historic lows given high cash flow growth and a lack of need to pay down debt or pursue external growth due to unfavorable cost of capital. In times of rising interest rates, dividend growth is the best way to maintain cost of capital, which can be useful if the acquisition market turns favorable.
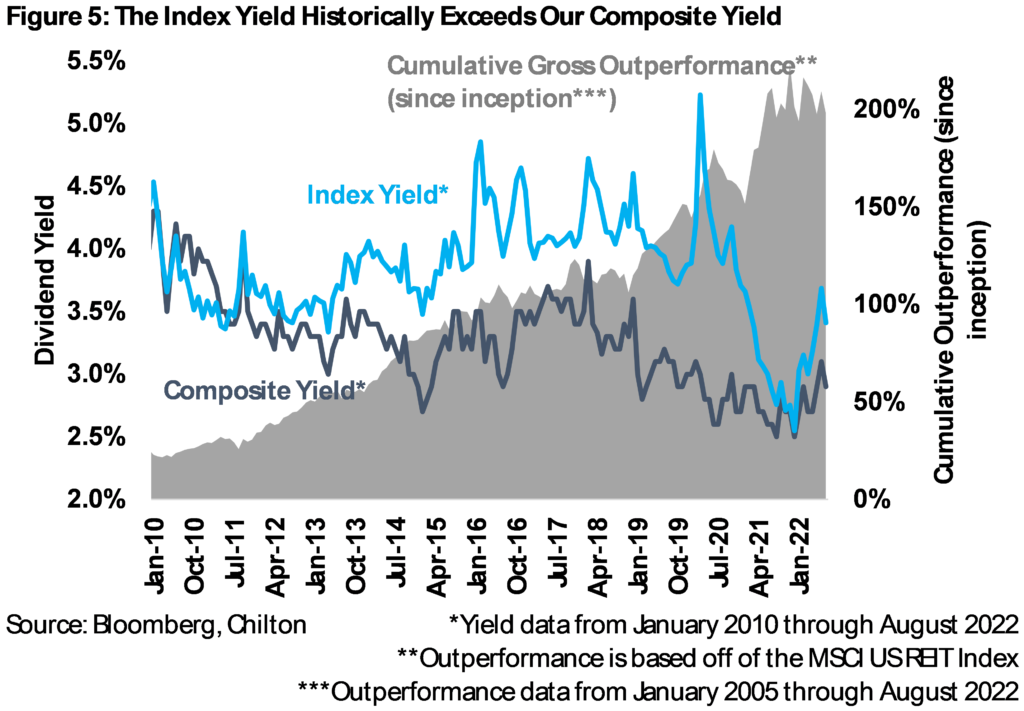
As a result of the aforementioned target price methodology, the Chilton REIT Composite dividend/AFFO payout ratio was 69% as of August 31, 2022. As shown in Figure 5, the yield on the Composite has been below the RMZ since 2011, which a yield-hungry investor may have found less attractive than a passive ETF, non-traded REIT, Japanese mutual fund, or maybe a Stanford Financial CD! In addition to having a lower payout ratio, the Composite has had lower leverage, less floating rate debt, and a longer weighted average maturity than the index, resulting in much lower risk. However, this process has produced 285 bps of annualized outperformance on a gross basis (200 bps on a net basis) versus the index for 17 years, equivalent to 198.5% on a cumulative basis gross of fees (130.2% net of fees). We believe focusing on ‘good’ yield instead of ‘high’ yield will continue to produce alpha in the future. Someday, we hope that investors will learn the lessons that REITs have had to go through to be more skeptical of investments that are too good to be true.
Matthew R. Werner, CFA
mwerner@chiltoncapital.com
(713) 243- 3234
Thomas P. Murphy, CFA
tmurphy@chiltoncapital.com
(713) 243-3211
Bruce G. Garrison, CFA
bgarrison@chiltoncapital.com
(713) 243-3233
Isaac A. Shrand
ishrand@chiltoncapital.com
(713) 243-3219
RMS: 2,594 (8.31.2022) vs. 3,177 (12.31.2021) vs 1,433 (3.23.2020) and 2,560 (2.21.2020)
An investment cannot be made directly in an index. The funds consist of securities which vary significantly from those in the benchmark indexes listed above and performance calculation methods may not be entirely comparable. Accordingly, comparing results shown to those of such indexes may be of limited use.)
The information contained herein should be considered to be current only as of the date indicated, and we do not undertake any obligation to update the information contained herein in light of later circumstances or events. This publication may contain forward looking statements and projections that are based on the current beliefs and assumptions of Chilton Capital Management and on information currently available that we believe to be reasonable, however, such statements necessarily involve risks, uncertainties and assumptions, and prospective investors may not put undue reliance on any of these statements. This communication is provided for informational purposes only and does not constitute an offer or a solicitation to buy, hold, or sell an interest in any Chilton investment or any other security. Past performance does not guarantee future results.