
Why Buy Fixed Income When Your Income Can Grow With REITs? | February 2021
After a 40 year decline in interest rates to record lows, both for corporate and government bonds, fixed income investors can pop the champagne and celebrate the gains and income they have received. Coupled with the strong S&P 500 performance in the past few years, traditional 60% equity / 40% fixed income (or ‘60/40’) portfolios have done much better than investors could have imagined. However, in the aftermath of the party, such investors are stuck with a problem; what to do now?
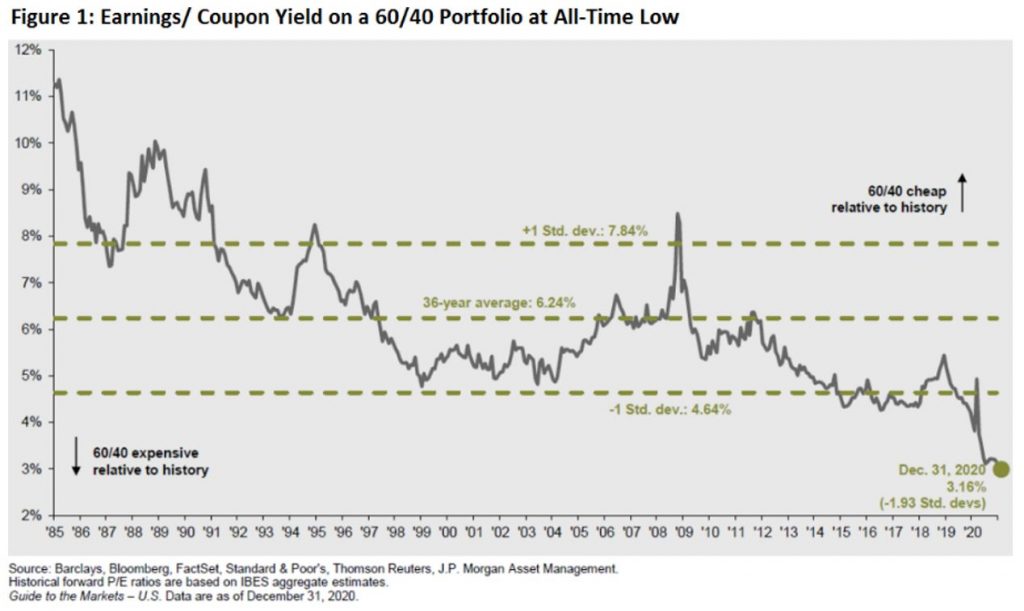
Investment grade fixed income at 1-2% coupon rates for the next 10 years when inflation is expected to increase essentially guarantees little to no real returns (i.e. return above inflation), while the current multiple on the S&P 500 does not have much room to increase. As shown in Figure 1, the 60/40 portfolio using the S&P 500 and the Barclays US Aggregate yield-to-worst is at the lowest of all-time, meaning the expected returns going forward has never been lower. In this environment, we believe investors should look to REIT equities and preferred equity to fill the gap due to their above average yields and potential to increase dividends in an inflationary environment.
Risk vs Reward
One of the basic principles of investing is to find the best risk-adjusted reward. Obviously, even the most risk-averse investors would like to have the highest reward, but ultimately settle for something less due to the fear of loss. A higher potential for gain usually carries with it a higher potential for loss, and vice versa. Looking at Figure 2, a perfectly efficient market (which assumes that all prices perfectly reflect the risk-reward from known information) should have a direct relationship between risk and reward (the blue line). According to Harry Markowitz, the way to construct a portfolio that will be above the risk-reward line (i.e. higher return for each unit of risk) is to use diversification of multiple securities and/or asset classes that have low correlation with each other. The potential portfolio return is simply the weighted average of the individual security or asset class returns, while the risk is lowered because of the diversification. In simple terms, an investor can get the same return while taking less risk, which increases the risk-adjusted return (the orange line).

As active managers, we do not fully subscribe to the efficient market theory because we believe we can isolate mispriced securities consistently to produce risk-adjusted returns above the market for REITs through our fundamental analysis. However, we do believe in diversification to lower risk, especially when looking at an entire portfolio (i.e. not just a REIT allocation).
What is Risk?
Within the REIT strategy, we measure security risk by assessing the balance sheet, durability of cash flows, competency of management, and corporate governance. It’s an inexact science, but the purpose of attempting to quantify each of these risks is to ensure that the potential reward for investing the security exceeds the risk. Each security’s risk level corresponds to a ‘required return’. If the potential return is below the required return, the stock is either a ‘hold’ or a ‘sell’. When the return exceeds the risk, the stock is a ‘buy’; however, we may decide to hold off on a buy if the correlation with another attractively-priced security is high, which would diminish the positive effects on the portfolio risk-adjusted return.
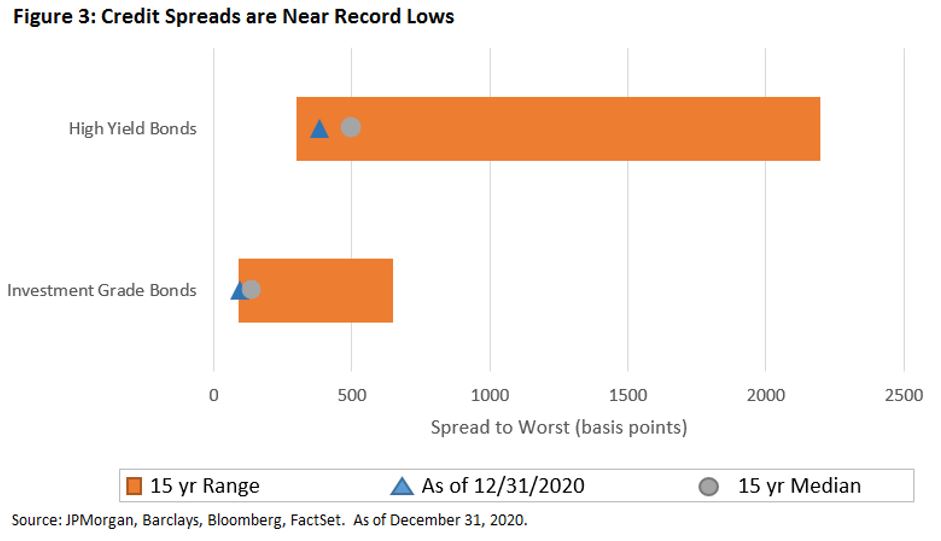
Fixed income risk is measured by the credit quality of the issuer as well as the duration of the bond. A bond backed by the US Treasury is considered ‘risk-free’, and the yield of all other bonds are usually measured against its comparable US Treasury maturity bond yield. A change in credit quality of the issuer would change the value of the underlying bond versus the comparable US Treasury. As of December 31, 2020, the spread of investment grade bonds (represented by the Bloomberg Barclays Aggregate Bond Index) was close to a 15 year low, and the high yield bonds (represented by the Bloomberg Barclays US Corporate High Yield Bond Index) were close to a 15 year low, as shown in Figure 3. As such, the risk of the spreads going back to even the median spread for the past 15 years could wipe out years of return without any increase in Treasury yields!
Duration measures how sensitive a security is to a change in interest rates, and is directly correlated to the amount of time until the bond matures. As interest rates move higher, the value of a bond moves lower (and vice-versa). The farther away the maturity date is, the higher the duration, and thus the higher the sensitivity to changes in interest rates. With interest rates and spreads near all-time lows, absolute yields are also near all-time lows. Given the positive slope of the yield curve, higher yields are only possible by going farther out in maturity, thereby increasing the duration risk.
Of note, Chilton has a team that manages custom fixed income portfolios comprised of mostly individual investment-grade corporate bonds which we believe will provide higher returns than the index, but with minimal risk. Given our view that interest rates may rise in the future, the team currently favors using shorter duration bonds.
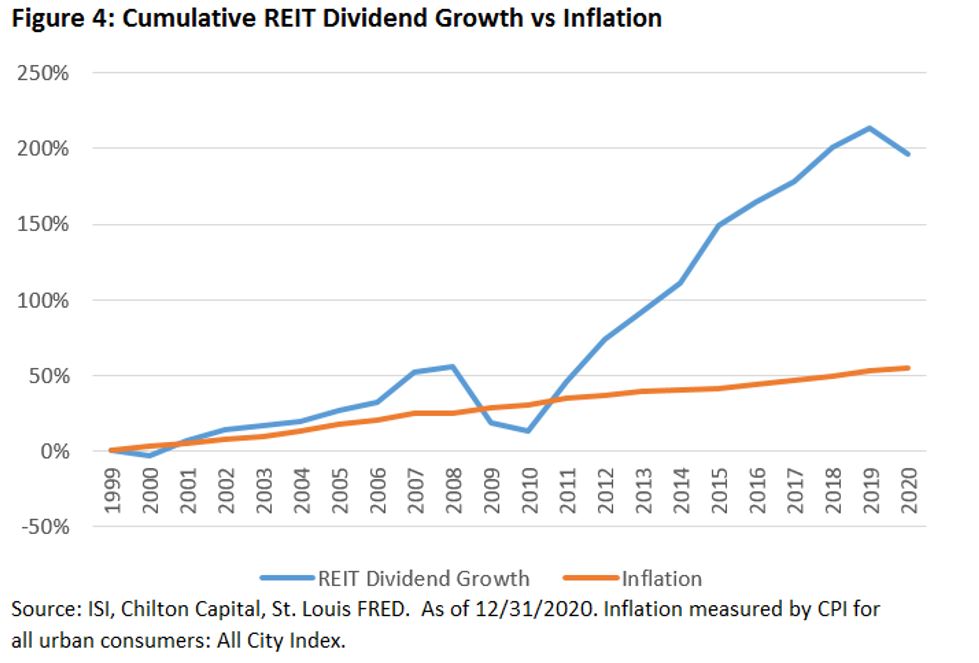
In contrast, equity REITs boast a yield of 3.7% as of January 31, 2021, as measured by the MSCI US REIT Index (Bloomberg: RMZ). The RMZ yield compares to the Bloomberg Barclays Aggregate Bond Index (Bloomberg: LBUSTRUU) yield of 1.2% and the Bloomberg Barclays US Corporate High Yield Bond Index (Bloomberg: LF98TRUU) yield of 3.6% as of the same date. In addition, REIT Boards of Directors have the ability to increase dividends as cash flow increases. Historically, REIT dividend growth has outpaced inflation, as shown in Figure 4. Thus, an investment in REITs can provide a hedge against inflation with a higher yield than fixed income, but with less duration and reinvestment risk.
Given the potential for dividend growth, REITs actually perform much better than fixed income in a rising interest rate environment. In the 10 periods we found where the 10 yr Treasury yield increased a minimum of 65 bps, the MSCI US REIT Index produced an average total return of +10.0%, the Barclays Aggregate Bond Index produced an average total return of -1.3%, and the Barclays High Yield Corporate Bond Index produced an average total return of +9.0%. Because of the volatility of REITs, the maximum drawdown (or the maximum observed loss from peak to trough) has been much higher for REITs than for fixed income historically. However, for investors with a time horizon of 10 years or more, REITs have historically had a similar minimum total return, but a much higher median and average return than the fixed income indices, as shown in Figure 5.

Let’s examine the risk and reward of a ‘risk-free’ investment, such as a 30 year Treasury note, versus REITs. The yield on the 30 year Treasury note as of January 31, 2021 was 1.8% and the duration was 21. Assuming only a 1% increase, equivalent to 100 basis points (or bps), in the 30 year Treasury yield, the price would decline by 21%, more than wiping out 12 years of the annual yield. Even a 10 year Treasury bond with a yield of 1.1% as of the same date and a duration of 9 would suffer a 9% loss, wiping out 8 years of annual yield. With yields near an all-time low, a long term investor should be concerned with duration risk of any fixed income investment.
We can also hypothesize performance of the REITs under the same scenario. With dividend growth of 6% and a rise in the 10 yr Treasury yield of 100 bps, and assuming REITs return to the historical yield spread of 140 bps, REITs would produce a total return of +15.8%. Even assuming REITs remain at the current elevated 260 bps spread versus the 10 yr Treasury yield, REITs would be able to produce a flat total return if the 10 yr Treasury yield rises 100 bps!
Historical Perspective
In the 1960’s and 1970’s, REITs were used as a fixed income substitute for investors looking for higher yield with some growth. Unfortunately, the REIT structure attracted mostly mortgage REITs that took on too much risk and used external management to deplete the REIT with fees. Equity REITs rose out of the ashes as the more durable structure, and this time were compared to the S&P 500. It seemed to give the nascent industry some forced respectability since total returns bested the S&P until about five years ago.
Other key events included the start of the Modern REIT Era (1991), the inclusion of REITs within the S&P 500 (2001), and the separation of REITs from Financials into its own GICS sector (2016). Further, multiple studies demonstrated the diversification benefits of adding REITs to a 60/40 portfolio to lower risk and enhance returns. Each of these has helped to raise the profile of REITs to individual and institutional investors, but the niche sector still does not have a consensus response to the question, “should REITs be compared to equities, or fixed income?”
In the current environment of low interest rates, we believe investors should re-visit equity REITs as a compelling alternative to fixed income. The high quality of the properties, transparency of earnings, enhanced corporate governance, access to capital, and low leverage has made REITs safer than they ever have been, in our opinion. REITs are frequently undervalued in the market and, by the measures we track, we are in such a period today. In fact, one of the leading research firms recently noted that REITs had fallen in the ‘cheap’ category for the first time in 20 years since they were undervalued relative to equities, bonds, and private real estate!
Chilton REIT Income Strategy
In response to the lack of yield available to fixed income investors today, we have launched the Chilton REIT Income Strategy. While the traditional Chilton REIT Strategy is ‘total return focused’, or indifferent between producing returns through yield or appreciation, the Chilton REIT Income Strategy will have a yield above that of the MSCI US REIT Index. The Chilton REIT Income Strategy will use a combination of the higher yielding names in the Chilton REIT Strategy and REIT preferred equity to generate the above average yield. As of January 31, 2021, the yield on the Chilton REIT Income Strategy was 4.7%, which compared to 2.9% for the Chilton REIT Strategy and 3.7% for the RMZ. Please reach out to your wealth manager for further information.
Matthew R. Werner, CFA
mwerner@chiltoncapital.com
(713) 243-3234
Bruce G. Garrison, CFA
bgarrison@chiltoncapital.com
(713) 243-3233
Brandon J. Frank
bfrank@chiltoncapital.com
(713) 243-3271
RMS: 2224 (1.31.2021) vs 2220 (12.31.2020) vs 346 (3.6.2009) and 1330 (2.7.2007)
Previous editions of the Chilton Capital REIT Outlook are available at www.chiltoncapital.com/category/library/reit-outlook/.
An investment cannot be made directly in an index. The funds consist of securities which vary significantly from those in the benchmark indexes listed above and performance calculation methods may not be entirely comparable. Accordingly, comparing results shown to those of such indexes may be of limited use.
The information contained herein should be considered to be current only as of the date indicated, and we do not undertake any obligation to update the information contained herein in light of later circumstances or events. This publication may contain forward looking statements and projections that are based on the current beliefs and assumptions of Chilton Capital Management and on information currently available that we believe to be reasonable, however, such statements necessarily involve risks, uncertainties and assumptions, and prospective investors may not put undue reliance on any of these statements. This communication is provided for informational purposes only and does not constitute an offer or a solicitation to buy, hold, or sell an interest in any Chilton investment or any other security.


