
Tipping Point: The New Diversified Portfolio Needs REITs | October 2025
Almost fifteen years ago, we debuted the Chilton REIT Outlook in July 2011 titled ‘The Role of REITs’ with the goal of informing clients and prospects about the benefits of adding REITs to their portfolios. Many of the attractive attributes of REITs remain today, but the investment landscape is vastly different. Ultimately, the MSCI US REIT Index (Bloomberg: RMZ) delivered a +7.3% annualized total return over the ensuing 14 years (June 2011-June 2025), in line with our long-term +6-8% projection for the benchmark. Investors in the Chilton REIT Strategy received a +9.4% total return gross of fees (+8.6% net of fees) over the same time period, as we were able to exceed our goal of +200 basis points (bps) of annual outperformance, gross of fees. But, was allocating to public REITs additive to a traditional 60% equities / 40% fixed income (60/40) portfolio? Where do public REITs fit in for the next 15 years?
–
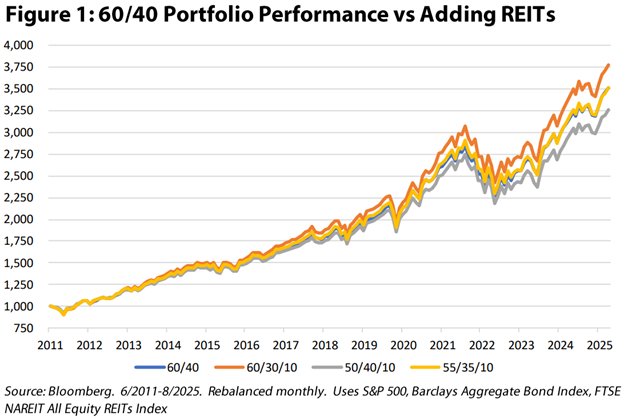
In 2011, we recommended a 10-20% allocation to REITs to diversify a typical 60/40 portfolio. As shown in Figure 1, an investor that substituted public REITs for his or her fixed income allocation did better than the 60/40 portfolio, while a ratable sale of fixed income and equities to fund a 10% REIT allocation was in line with a 60/40 portfolio. However, REITs did not receive the inflows that we would have expected, and other asset classes benefited from investors looking beyond a 60/40 portfolio. In summary, while REITs performed as we would have hoped over the past 14 years, those who overweighted equities and private equity while underweighting fixed income were able to outperform the 60/40 portfolio.
–
–
Investment options for all investors have multiplied; from alternatives including private equity, private credit, private real estate, to a public market that now counts more ETFs than publicly traded companies (yes, this is true), investors and asset allocators can tailor a portfolio to meet any level of risk and expected return. As such, the onus rests upon public REITs and REIT managers to justify an allocation among so many options.
–
First, commercial real estate is a hard asset, which provides inflation protection over time due to rising replacement costs. In addition, while a portion of investors may have confidence in the value of a cryptocurrency with no actual underlying assets or revenue, others sleep better knowing that there is an underlying asset that will maintain at least some value even in uncertain economic periods.
–
Second, dividends matter. It may not be as ‘sexy’ as an AI venture startup with 100x return potential, but a mid-single digit yield that grows each year can be a powerful solution for clients that need income, or would at least like to ‘take some chips off the table’ without having to sell.
–
Third, REITs provide predictability, which lowers risk. In a world where it seems technology companies can beat earnings consensus by double digits, REITs rarely report earnings surprises that are greater than 1-2% away from consensus. Obviously, this can be a negative when other companies are having significant beats, but it is yet another comfort for investors that would like to rest knowing the downside is limited.
–
In today’s market, little premium (if any) is being ascribed to the above attributes. Therefore, REITs need to show a clear path to competitive prospective total returns, risk-adjusted or not. We believe that double-digit total returns are possible, which would be competitive with ‘realistic’ projections in public equities, private equity, and private credit, and well above the returns that can be expected from fixed income and cash. As such, we still recommend a 10-20% allocation to real estate, which can be comprised of a mix between public and private depending on the environment.
–
Markets are cyclical. The low-risk attributes of REITs will matter again, and garner a premium valuation. We recommend getting ahead of the trend before it arrives.
–
Don’t Let Recent Performance Color Your REIT Return Expectations
With all the competition above, how do public REITs stack up? We believe that double digit returns are possible, while downside risk is minimal as this point in the cycle. Notably, we believe that the base case for the next five years is 8-10%, driven by a 4% dividend yield and dividend growth in the 4-6% range annually. However, if there is a decline in long term rates, which is entirely possible with the current assumptions for four or five more rate cuts, the annual returns could exceed 10%.
–
–
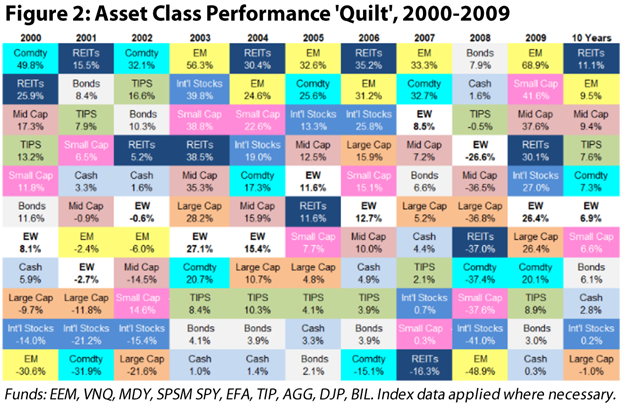
As we stated in our May 2025 REIT Outlook, we believe the setup for REITs is similar to 1999. At the time, public REITs were trading near a 20% discount to net asset value (or NAV, the estimated private market value of REIT assets minus liabilities), similar to today’s median discount to consensus NAV. Furthermore, REITs were out of favor given the impressive tech-driven performance of the S&P 500 in the previous 2-3 years. When technology stocks sold off in 2000-2001 and the Fed began their rate-cutting cycle, REITs were the best-performing asset class for three of the next seven years, and the top-performing asset class of 2000-2009 (Figure 2). We believe that the yield, safety, and hard assets will come back into favor at some point, and the favorable supply/demand dynamics that will play out for the next 3-5 years could drive REIT prices back above NAV at a time when NAVs are increasing due to growth in net operating income, creating a positive feedback loop. As such, we believe that, even without adjusting for risk, public REITs can produce total returns that are at or above private real estate.
–
Many Investors are Underweight REITs – For Now
The equity market capitalization of REITs has grown to $1.4 trillion as of July 31, 2025 from $455 billion on June 30, 2011. According to NAREIT, public REITs own $2.5 trillion in commercial real estate assets. However, experts believe the total value of commercial real estate as of December 31, 2024 stood at $26.8 trillion, making public REITs only 9% of the pie. This number stood closer to 10-15% back in 2011. Alternatives have gained significant footing in the typical investor portfolio over the past 10 years, taking share from public REITs. In addition to the boom in private equity, the breadth of ETF options has brought alternatives to the mainstream. The same is true for real estate private equity, which has seen the revival (at least for now) of the non-traded REIT, as well as record high private real estate fund raising, eschewing the public REITs from taking their share of acquisitions.
–
–
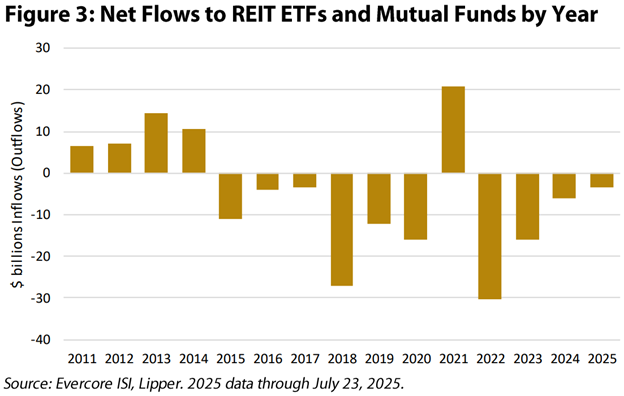
The result of this competitive environment for share of investor wallets has been steady net outflows from public REIT mutual funds and ETFs, as shown in Figure 3. While outflows in 2022 with the unexpectedly rapid rise in interest rates made sense, the steady decline over time, especially in the preceding years as the Fed maintained a Zero Interest Rate Policy shows a shifting investor preference. The good news for REIT investors is that the net outflows have been shrinking, setting the stage for 2026.
–
What Are Investors Looking For?
The clear winners for flows in the 2010-2021 period were private equity, private real estate, and private credit.
–
First, fundraisers were able to repackage ‘illiquidity’ as ‘low volatility’ for all private assets (private equity, private real estate, and private credit). Whereas it was historically a negative attribute to have to lock-up an investment for an extended time period, investors have shown that they are more than willing to do so in exchange for little to no ‘statement volatility’. Some of that is changing with the growth in ‘semi-liquid’ alternatives such as ‘interval funds’, ETFs holding private companies, and ‘evergreen’ funds (including non-traded REITs), but, even so, investors don’t seem to mind that their investments are being ‘marked to market’ infrequently (ignorance is bliss!).
–
Additionally, investors have been willing to pay much higher fees for illiquidity, as the average fee for an alternative investment is 1-2%, plus the potential for an incentive fee above a threshold (e.g., 10-20% of gains above 8%). This compares to the average public equity ETF fee of 0.1-0.2%, and average mutual fund fee of 0.6-1.0%. For reference, Chilton’s fees top out at 1.0% with no incentive fees.
–
–
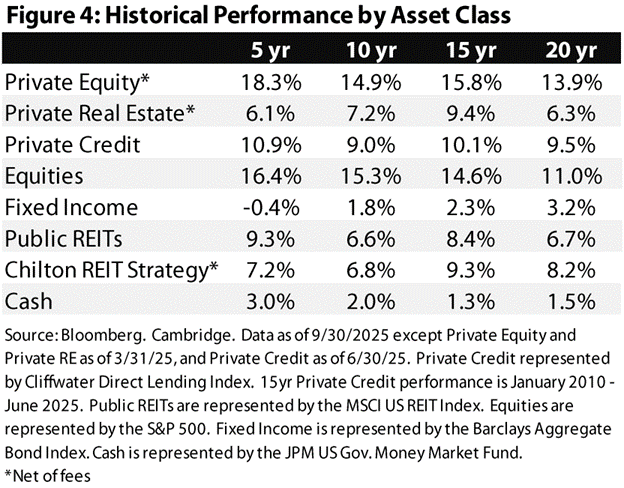
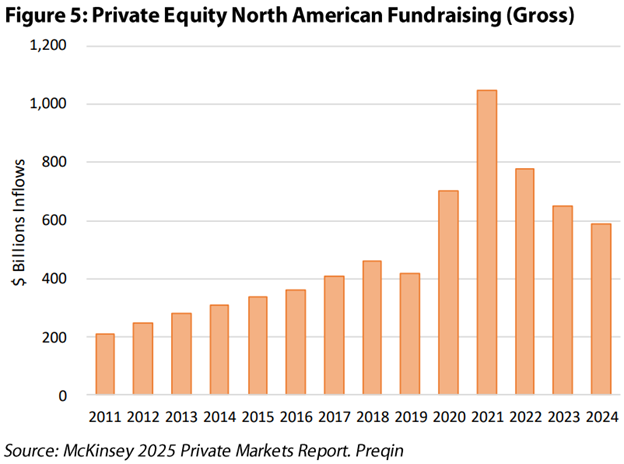
As shown in Figure 4, private equity has certainly earned the flows it has garnered over the past five and ten years. The types of private equity are extremely diverse, but the performance track record in the recent ‘golden era’ of private equity speaks for itself. However, trees can’t grow to the sky. The massive inflows (Figure 5) looking for deals and slowing liquidity events have left over $1.3 trillion of private equity capital on the sideline as it has become more difficult to find deals that meet the return criteria, according to Bain & Co. According to MSCI, 2023 and 2024 were the first years since it began tracking the data in 2010 that average exit multiples have been below where they were being marked in their NAV. Investors have taken note, as 2024 fundraising was down 50% from 2021, and there are numerous funds that have fallen short of their targets. Going forward, higher interest rates and a much more competitive market could make it difficult to replicate the impressive historical performance.
–
–
Private Real Estate was certainly a beneficiary of flows away from public REITs, or at least prevented inflows that could have gone to public REITs. As we have discussed many times in the past (April 2025, April 2023 REIT Outlooks, for example), those who invested in high leverage private real estate from 2015-2020 were rewarded handsomely. Fueled by declining interest rates and, as a result, declining cap rates, total returns were easily in the double digits, outpacing most other asset classes. However, valuations peaked at the end of 2021, as rising interest rates and cap rates, combined with high leverage, destroyed a significant portion of returns. With long-term rates seemingly range-bound between 4% and 5%, high leverage only adds risk without the corresponding increase in cash-on-cash returns as all-in borrowing costs can be at or even above acquisition cap rates. From presentations we have seen, it appears that a high single digit return is the new ‘realistic’ target for high quality stabilized real estate. Of course, a significant decline in rates could magnify this number, but we are skeptical of any projections that are underscored by the ‘hope’ of lower rates. Going forward, it appears that private real estate is here to stay as an allocation for a broader audience of investors; as such, as in the past, we advocate for a balanced portfolio where public REITs serve as a ‘core’ allocation, and private real estate is more ‘opportunistic’ where the risk is worth the reward.
–
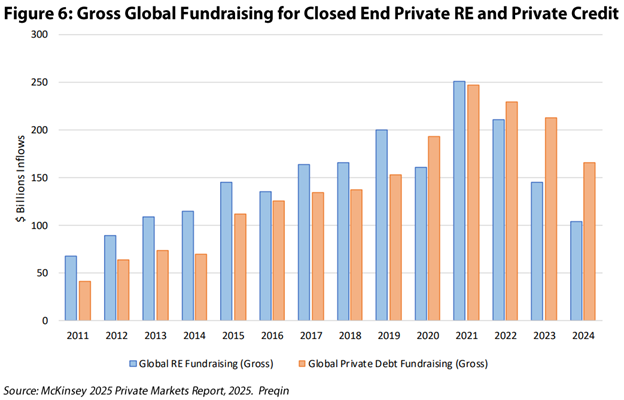
Private Credit has been around for decades, though its popularity has boomed in the past few years as higher floating rates have pushed the yields into double digits. In addition, hefty bank regulations have precluded banks and traditional lenders from the market, allowing investors to step in without the steep competition from lower cost of capital banks. As shown in Figure 6, the renaissance of this asset class has been nothing short of extraordinary. Most of the funds we have seen have excellent track records of avoiding losses, and payouts have been solidly in the 8-11% range net of fees. However, these yields are likely to decline as the Fed embarks on cutting rates. The market is currently pricing in another four or five rate cuts after the September rate cut, which would bring down yields by another 100-125 basis points. Furthermore, the fees are above average, comprised of an annual management fee of 1-1.5%, plus an incentive fee of 10-12.5% above a mid-single digit threshold. The all-in return should still be above fixed income, but could fall below public REITs if the Fed follows through with the expected rate cuts.
–
–
Despite losing some share to alternatives, we believe that equities, fixed income, and cash should comprise the majority of all investor portfolios. The returns from the S&P 500 (and in particular the Chilton equity strategies!) have been impressive over the past five and ten years. While we hope that they continue, valuations are historically high and thus could possibly portend to lower returns over the next five to ten years. Fixed income is coming off of its worst drawdown in history (as measured by the Barclays Aggregate Bond Index) given the rapid rise in interest rates, but remains a key component for generating cash flow while maintaining liquidity. Corporate yield spreads are historically tight, meaning that incremental returns above the risk-free rate are minimal. Finally, while cash (via money market funds) has been able to generate a yield of 4-5% for the past few years, the Fed rate cut cycle could take yields below 3% in the next 16 months based on consensus estimates.
–
The New Diversified Portfolio
The new diversified portfolio looks a lot different than the traditional 60/40 portfolio that has long been purported by academics and wealth managers. The growth in alternatives, especially as a replacement for fixed income, has definitively helped investor returns in the past 14 years. However, the pullback in flows to private equity and real estate indicate that it may be difficult to replicate the success of the past. In contrast, public REITs have seen their role diminish in the recent past, a trend that may also reverse. We firmly believe that public REITs have an important role to play for diversification of risk, while also producing competitive returns and cash flow.
–
We encourage our readers to reach out to Chilton advisors for a review, especially as gains in public equities and other asset classes may have left public REITs underweight in diversified portfolios relative to our 10-20% recommendation.
–
Matthew R. Werner, CFA
mwerner@chiltoncapital.com
(713) 243- 3234
Thomas P. Murphy, CFA
tmurphy@chiltoncapital.com
(713) 243-3211
Bruce G. Garrison, CFA
bgarrison@chiltoncapital.com
(713) 243-3233
Isaac A. Shrand, CFA
ishrand@chiltoncapital.com
(713) 243-3219
–
RMS: 3,106 (9.30.2025) vs. 2,966 (12.31.2024) vs. 3,177 (12.31.2021) vs. 1,433 (3.23.2020)
–
An investment cannot be made directly in an index. The funds consist of securities which vary significantly from those in the benchmark indexes listed above and performance calculation methods may not be entirely comparable. Accordingly, comparing results shown to those of such indexes may be of limited use.)
The information contained herein should be considered to be current only as of the date indicated, and we do not undertake any obligation to update the information contained herein in light of later circumstances or events. This publication may contain forward looking statements and projections that are based on the current beliefs and assumptions of Chilton Capital Management and on information currently available that we believe to be reasonable, however, such statements necessarily involve risks, uncertainties and assumptions, and prospective investors may not put undue reliance on any of these statements. This communication is provided for informational purposes only and does not constitute an offer or a solicitation to buy, hold, or sell an interest in any Chilton investment or any other security. Past performance does not guarantee future results.
Information contained herein is derived from and based upon data licensed from one or more unaffiliated third parties, such as Bloomberg L.P. The data contained herein is not guaranteed as to its accuracy or completeness and no warranties are made with respect to results obtained from its use. While every effort is made to provide reports free from errors, they are derived from data received from one or more third parties and, as a result, complete accuracy cannot be guaranteed.
Index and ETF performances [MSCI and VNQ and FNER and LBUSTRUU] are presented as a benchmark for reference only and does not imply any portfolio will achieve similar returns, volatility or any characteristics similar to any actual portfolio. The composition of a benchmark index may not reflect the manner in which any is constructed in relation to expected or achieved returns, investment holdings, sectors, correlations, concentrations or tracking error targets, all of which are subject to change over time.


