
Public REITs Are Positioned for Trophy Office Upside | June 2025
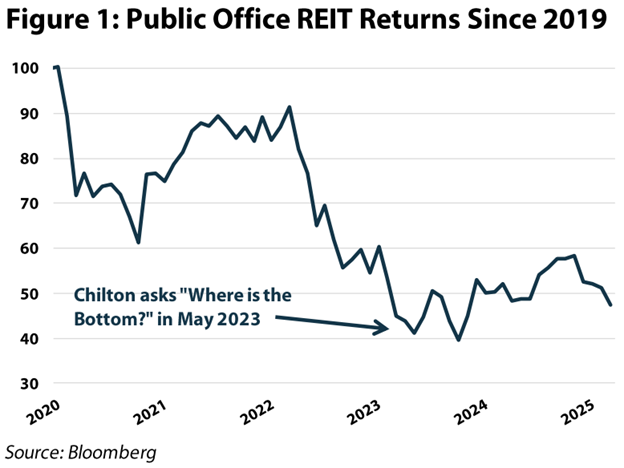
We published on the office sector two years ago and, following an over 50% pullback between March 2022 and May 2023, contemplated a potential bottom for public office REITs. The bottom arrived several months later (Figure 1); however, that datapoint only scratches the surface of the office saga. In our opinion, the real story lies in the bifurcation within office (which we believe is accelerating), creating an environment ripe for the best positioned public office REITs.
–
–
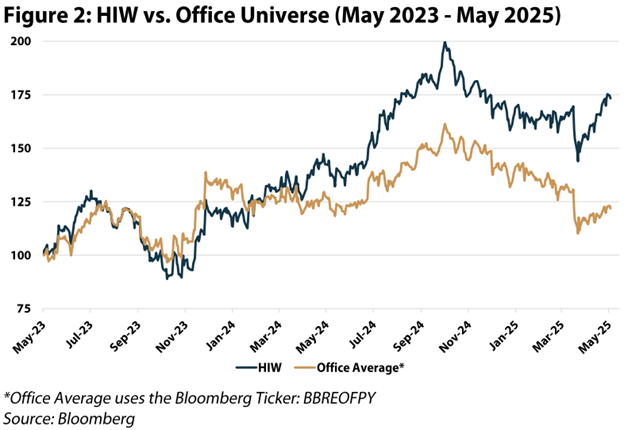
In 2023, our confidence was not predicated on return to office (RTO) driving a leasing improvement. Rather, we believed valuation for this cyclical industry fell to such a depth that, even without an inflection in fundamentals, we could generate attractive risk-adjusted returns. We resolved to “pick our shots” within office, and, after drilling into the balance sheets and leasing expiration schedules, began purchasing Highwoods Properties (NYSE: HIW) in May of 2023. HIW’s earnings ultimately declined through 2024 as we had expected, but as a testament to how low expectations were at the time, HIW emerged from 2024 as the one of the best performing REITs (not just office!) with a +43% total return. Furthermore, HIW also meaningfully outperformed the office REIT universe (Figure 2). Part of this outperformance was driven by HIW’s heavy weighting to the Sunbelt, but more importantly, HIW was trading at a valuation that implied a much steeper decline in earnings and overlooked a strong balance sheet. Our purchase of HIW is an example of our process sometimes leading us to companies that don’t need to grow earnings to generate returns for our investors. With valuations improved in 2025, the thesis for investing in office has changed somewhat, requiring at least flat earnings growth to justify investment. However, as we detail below, we believe the current leasing velocity is pointing to positive earnings growth in the coming years.
–
–
While RTO mandates are gaining steam, the uncertainty raised since April 2nd is clearly a negative for business decision-making. However, many tenants have already delayed leasing decisions for several years and one can only kick the can so far before a decision must be made. Barring a deep recession, we believe the “rubber is finally meeting the road” for leasing and, even with some elevated macro uncertainty, office leasing for quality buildings should continue to strengthen.
–
On top of potential demand improvements, the sustained underbuilding in office has created an anemic supply backdrop. Further, we believe the quality bifurcation within office remains underappreciated, and REIT portfolios will emerge best positioned as obsolete buildings continue to lose occupancy and are eventually removed from the market or transitioned to alternative uses, such as residential. Most importantly, we do not believe these potential tailwinds are reflected in current valuations.
–
As such, we have increased office exposure through three avenues. First, we reloaded our position in HIW after trimming the name in late 2024 at peak pricing. Second, we added gateway bellwether BXP Properties (NYSE: BXP) to gain exposure to coastal markets (most notably NYC) outside of HIW’s Sunbelt focus. Finally, we pushed further along the risk spectrum and added the niche Life Science REIT Alexandria Real Estate (NYSE: ARE). Note that today’s report focuses on traditional office as we look to cover life science in a later outlook.
–
Chilton Exposure
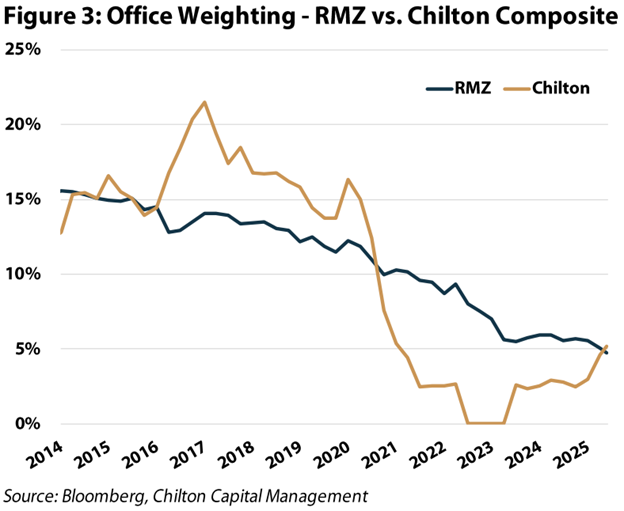
As highlighted in Figure 3, compared to the MSCI US REIT Index (Bloomberg: RMZ) our strategy has held a meaningful underweight to office REITs for much of the last several years. We began trimming office at the start of the pandemic, with our exposure declining to 0% by the middle of 2022. As we detailed above, we added a modest position in Highwoods Properties (NYSE: HIW) but maintained an overall office underweight until the recent additions.
–
–
Private Markets
As we highlighted above, Office REITs comprised under 5% of the RMZ as of May 31st, 2025. For comparison, as of mid-2024 the NCREIF Property Index (aggregate of privately owned buildings) was still comprised of nearly 20% office. The CMBS market tells a similar story with nearly 30% of outstanding debt tied to office properties. Some of CMBS covers quality assets – such as Tishman’s successful $3.5 billion refinancing of Rockefeller Plaza last year at 6.23% – but many of the issuances cover high vacancy properties facing material stress. Case in point, of CMBS office loans over $100 million, only 30% were paid on time in 2024.
–
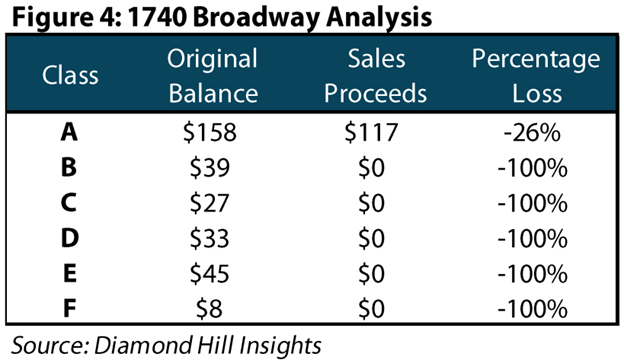
The saga at 1740 Broadway (“Mutual of New York” immortalized in Tommy James’ 1968 hit Mony Mony) provides a cautionary tale. Blackstone (NYSE: BX) purchased the property in 2014 from Vornado (NYSE: VNO) for a gross price of $605 million – or nearly $1,000 per square foot. Despite Blackstone’s spending on amenities and a new lobby, major tenant exits (notably L Brands in March 2022) left much of the building vacant, and, shocking industry participants, Blackstone handed back the keys in 2022. A 2023 appraisal determined the building’s value had declined to $175 million, leading S&P to cut its rating from AAA to BB+ (below investment grade). Notably, this represented the first loss on a AAA bond since the 2008 crisis, and, moreover, every tranche below was entirely wiped out (Figure 4).
–
–
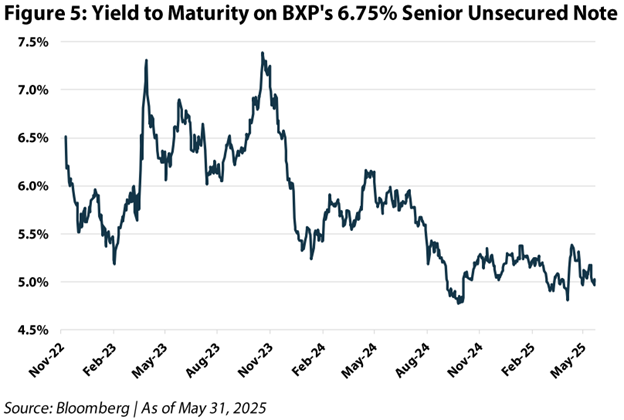
Using BXP as a comparison, we make two important distinctions. First, submarkets (even micro markets) can drive massive discrepancies in leasing success and property values. BXP’s 601 Lexington, with a similar size and vintage, and less than a mile west of 1740 Broadway, was 98.1% occupied at the end of 1Q25. Second, even at the most pessimistic times for office, BXP retained attractive access to the unsecured debt market. When rising rates led 1740 Broadway to languish on the sales block, BXP successfully issued $750 million 5-year green bonds in late 2022 at 6.75% (versus a 10-year treasury yield of ~4% at the time). As shown in Figure 5, the bond is now trading below a 5% yield to maturity. More recently, BXP issued $850 million of unsecured 10-year notes in August 2024 at 5.75%, which was at a similar time to Rockefeller Plaza’s refinance but at a 50 basis point (bps) lower rate.
–
–
Return to Office (RTO) Drives Leasing
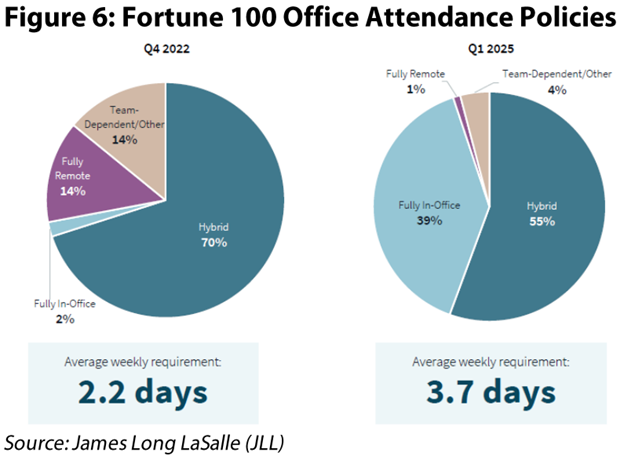
It is no secret that remote working policies are evolving. While the shift hasn’t been universal, largely speaking, companies are once again prioritizing in office interaction. Figure 6 compares the attendance policies of Fortune 100 companies in 4Q2022 and 1Q2025, showing average weekly in-office requirements increasing from just 2.2 days to 3.7 days.
–
–
There is a timing lag between policy changes translating into actual leasing volume, but in 1Q25 US office leasing reached 50.4 million square feet according to JLL. This added to the post-pandemic volume record set in 4Q24 and represented a meaningful improvement over the same period in 2024, but was still only 90% of typical pre-pandemic leasing volume. However, segmenting the market between “trophy” assets and everything else illuminates a noticeably different picture. According to data from CBRE, while cumulative office absorption (leased space minus vacated space) for non-prime buildings has been negative 166 million sqft since 1Q2020, absorption for prime buildings has been positive 60 million sqft. Moreover, overall market absorption flipped positive during 2024 and has now posted four consecutive positive quarters. While a pause from corporations on leasing decisions due to the recent tariff uncertainty could be a negative, based on the updates from REITs 1Q25 earnings calls, high quality office leasing has not slowed in 2Q.
–
New Construction Needs Higher Rents
While the demand data noted above is encouraging, the real justification for enthusiasm in office is the anemic supply outlook. Based on CBRE data, the office construction pipeline stood just over 20 million square feet at the end of 2024. This is a monstrous reduction from 4Q2020 when the industry had almost 120 million square feet under construction. Typically, an office project takes at least 18 months to construct (and even longer for permitting), which means that even if new construction picked up today, we would not expect any meaningful deliveries until 2027. Given where construction and financing costs sit today, we believe rents still need to increase materially to induce any meaningful new construction, which gives us confidence in office occupancy resilience beyond 2027.
–
Quality Bifurcation = Obsolescence
The quality bifurcation referenced above is also having an impact on the inventory of available office buildings. Recall this was a focal point of our 2023 Office Report, where we made a bold call that up to half of the U.S. office market was either functionally obsolete or requiring so much investment that it could be at risk for demolition. While this dynamic is still playing out, our 2023 estimate might have been too conservative as we’ve started to see even quality buildings spiraling in doom loops.
–
Valuation Reflects More Dire Environment
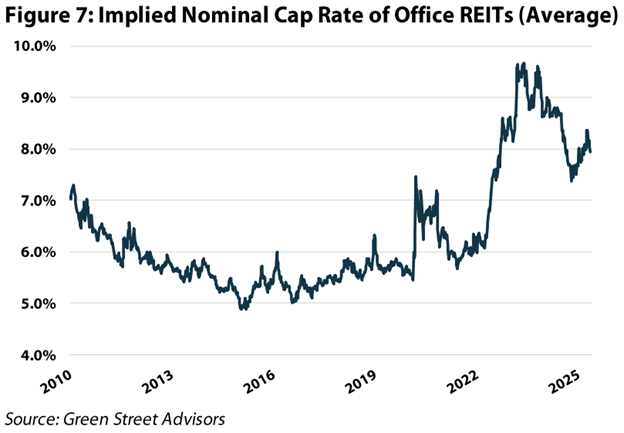
While we believe the supply/demand fundamentals laid out above support rising rents and earnings in the coming years, even in a flat earnings environment we believe the high-quality public office REITs are undervalued today. Specifically, as of May 31st, office REITs were trading at an implied cap rate (net operating income/enterprise value) of 8%, which is higher than the group average of 7.4% in 2009 (see Figure 7). Even if we strip out some of the lower quality (read: West Coast) office REITs, we see very attractive opportunities to invest in high quality buildings at low valuations.
–
–
HIW: Undervalued Sunbelt Specialist
Our largest office position, HIW, was trading at 9.0% implied cap rate as of May 31st. While this is a notable improvement from the 10% level noted for 2023, it remains meaningfully discounted to where we believe the private market values HIW’s portfolio. Case in point, HIW disposed of three suburban Tampa office buildings in early 2025 for $145 million at an estimated cap rate of 7.8%. Although occupancy of 92% on these buildings is slightly above the HIW’s portfolio average, we would argue that the growth profile is below the portfolio average due to the asset’s age (average is 36 years old) and suburban positioning. However, if we assume these properties are in line with the portfolio average, a 7.8% cap rate with no NAV discount would imply over 40% upside from HIW’s May 31 share price.
–
BXP: Market Leader in Premier Workspaces
As the largest public company in the office sector, BXP is viewed by many investors as the “tip of the spear” in terms of premier workspaces. Based on internal studies BXP undertook with third party brokers, they found that “premier buildings” only represented 13% of the office market while BXP’s portfolio is almost entirely premier workplaces (additionally 60% of BXP’s NOI comes from NYC and Boston – the coastal markets we are most favorable towards). Although premier workplaces were not entirely immune to the impacts of work from home, BXP’s portfolio has held up much better than the broader market and stood at 89.3% at the end of 1Q25.
–
More importantly, based on today’s impressive leasing velocity, we see a de-risked pathway back to the low 90’s occupancy. Specifically, BXP has executed an average of 1.3 million sqft of leases over the trailing five quarters. Looking forward, with leasing expirations normalized to only 440,000 sqft per quarter in 2026, we see ample opportunity for BXP’s occupancy to quickly recover. Occupancy changes have outsized impacts on earnings growth, and, while the industry saw the downside of this relationship in 2024, we believe occupancy growth could flip meaningfully positive for 2026 and 2027. On top of this underlying growth, we also see development adding over $100 million of annualized net operating income (NOI) in the coming years. Our internal model conservatively assumes low single digit annual AFFO growth on modest occupancy improvements to justify our target price, but our bias is to the upside.
–
Conclusion
While the office sector still faces some challenges, its story is no longer one of broad-based weakness but rather of accelerating bifurcation. Quality assets in strong markets are increasingly outperforming as obsolete buildings face functional decline or conversion.
–
Our existing office position in HIW was never tied to a near-term leasing rebound but rather to overly dislocated valuations. This thesis played out quite well in 2024 with HIW emerging as one of the best performing REITs and meaningfully outperforming its office peers. As we look forward, while valuations have improved, they remain discounted to private market trades we have seen for quality assets.
–
Additionally, with leasing decisions becoming harder to delay, return-to-office momentum building, and new supply at generational lows, we see conditions improving for the best positioned office buildings. As a result, we’ve increased our exposure through targeted investments in HIW (increased), BXP, and ARE, positioning our strategy to benefit from the evolving dynamics and long-term resilience of high-quality office portfolios. Overall, our office exposure is overweight the Sunbelt with targeted coastal exposure, while we remain meaningfully underweight to the West Coast.
–
Thomas P. Murphy, CFA
tmurphy@chiltoncapital.com
(713) 243-3211
Matthew R. Werner, CFA
mwerner@chiltoncapital.com
(713) 243- 3234
Bruce G. Garrison, CFA
bgarrison@chiltoncapital.com
(713) 243-3233
Isaac A. Shrand, CFA
ishrand@chiltoncapital.com
(713) 243-3219
–
RMS: 2,982 (5.31.2025) vs. 2,966 (12.31.2024) vs. 3,177 (12.31.2021) vs. 1,433 (3.23.2020)
–
An investment cannot be made directly in an index. The funds consist of securities which vary significantly from those in the benchmark indexes listed above and performance calculation methods may not be entirely comparable. Accordingly, comparing results shown to those of such indexes may be of limited use.)
The information contained herein should be considered to be current only as of the date indicated, and we do not undertake any obligation to update the information contained herein in light of later circumstances or events. This publication may contain forward looking statements and projections that are based on the current beliefs and assumptions of Chilton Capital Management and on information currently available that we believe to be reasonable, however, such statements necessarily involve risks, uncertainties and assumptions, and prospective investors may not put undue reliance on any of these statements. This communication is provided for informational purposes only and does not constitute an offer or a solicitation to buy, hold, or sell an interest in any Chilton investment or any other security. Past performance does not guarantee future results.
Information contained herein is derived from and based upon data licensed from one or more unaffiliated third parties, such as Bloomberg L.P. The data contained herein is not guaranteed as to its accuracy or completeness and no warranties are made with respect to results obtained from its use. While every effort is made to provide reports free from errors, they are derived from data received from one or more third parties and, as a result, complete accuracy cannot be guaranteed.
Index and ETF performances [MSCI and VNQ and FNER and LBUSTRUU] are presented as a benchmark for reference only and does not imply any portfolio will achieve similar returns, volatility or any characteristics similar to any actual portfolio. The composition of a benchmark index may not reflect the manner in which any is constructed in relation to expected or achieved returns, investment holdings, sectors, correlations, concentrations or tracking error targets, all of which are subject to change over time.


Great Report!!
Question: What can be done with other office buildings that are in distress, in your opinion?
The reason I ask is because there is a need for, at least, 60,000 homeless Veteran’s across the country to find proper accommodations and support. These Veterans are eligible for federal government support. Those that support helping these Veterans open themselves to many benefits, such as tax benefits, additional funding that does not need to be paid back, etc.
This an approach that can allow For Profits and Non Profits to come together for mutual purposes. By the way the approach is modeled after the second largest landholder in the world. Please let me know what you think. Contact me and I will gladly explain.
P.S. : This approach can attract hundreds of billions of dollars from investors; open up a Real Estate inventory worth, at least, $500 Billion. Also, there no competition in acquiring this inventory, picking out what you want.