The ‘X’ Factor for REITs | August 2024
Originally created in 1960, the REIT structure’s purpose was to democratize real estate for the masses. In addition to managing properties, reporting and complying with SEC requirements, and paying dividends from cash flow, they also employ finance, investment, development, and strategic personnel to make decisions that can grow value beyond a steady state portfolio. In fact, years ago they dropped the ‘trust’ classification and are now corporations (just like Apple and Exxon) that qualify for a favored tax status.
–
Together, along with guidance from executives and the board of directors, the company makes decisions to acquire, dispose, develop, or redevelop properties, sell or buy back stock, and issue or retire debt. Called ‘capital allocation’, this is one of the most important – if not THE most important – qualities for a REIT, or any commercial real estate owner for that matter.
–
Like any company, a REIT should obey its weighted average cost of capital (or WACC) to make these decisions. For example, a widget company will decide between building a new factory or buying another company by comparing the expected returns on deploying this capital versus the returns it would make continuing on its status quo. Similarly, public REITs can compare their current stock price to the value of its properties (called Net Asset Value, or NAV) to determine whether external growth will be additive or destructive to NAV per share.
–
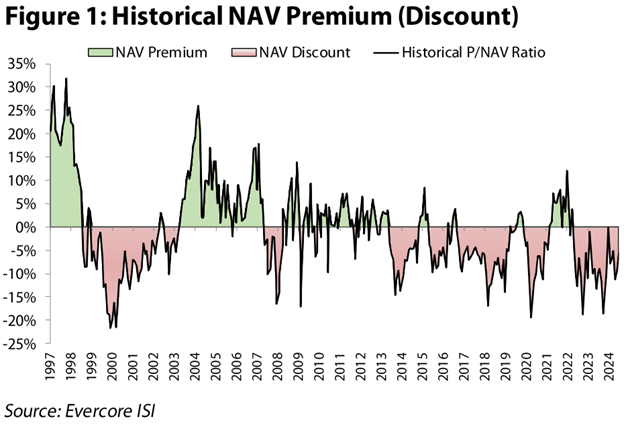
Historically, public REITs have enjoyed multi-year periods of trading at NAV premiums, giving them adequate time to raise capital and make accretive investments (acquisitions, mergers, development, redevelopment), which have benefited REIT investors. Theoretically, the companies raising accretive capital to invest in projects garner a larger NAV premium, creating a positive feedback loop. However, since 2010, REITs have traded at an NAV premium for only 8 months at the longest, and a median duration of NAV premium of only 3.5 months. As such, they have had to eschew an entire leg of the REIT value creation ‘stool’. While we can’t predict with certainty that this will change in the future, we do believe that investors should be aware of the potential for a ‘sea change’ that could revive this lost art.
–
We believe that public REITs have proven to be careful stewards of investor capital and should be trusted to make investments based on their cost of capital when it is advantageous for growth in dividends and net asset value. We see the next cycle being characterized by less speculation (i.e., lower supply given higher overall capital costs), a major ramp in rents to reflect rising replacement costs, and less competition from private equity relative to the recent past. We are confident that public REITs will be able to provide a risk-adjusted return that should be attractive to investors of all types and time horizons.
–
The Old Guard (1990’s, 2002 – 2006)
Back when REITs were thought to be boring companies that offered little growth but a steady stream of dividends, acquisitions were the primary method for growing NAV per share. In the dawn of the Modern REIT Era, many REITs that came public were small, and looked to the public market as a way to raise capital periodically to fund acquisitions. As shown in Figure 1, they traded at a significant premium to NAV in the mid-1990’s, which is a period when the equity market cap of equity REITs grew from $6 billion at the end of 1991 to $128 billion by the end of 1997.

–
By definition, a period of NAV premiums creates opportunities to acquire at cap rates above a REIT’s own cost of capital. ‘Spread investing’ was the name of the game during this time, where REITs could lock in a spread between the acquisition cap rates and their own cost of capital. This was admittedly helped by the capital shortage from traditional investors following major changes to tax rules for private owners in 1986 and the subsequent meltdown of many financial institutions including savings and loan associations. As an example, public REIT General Growth Properties (now owned by Brookfield) was able to purchase Ala Moana Center in Honolulu in 1999, now the most valuable mall in the world.
–
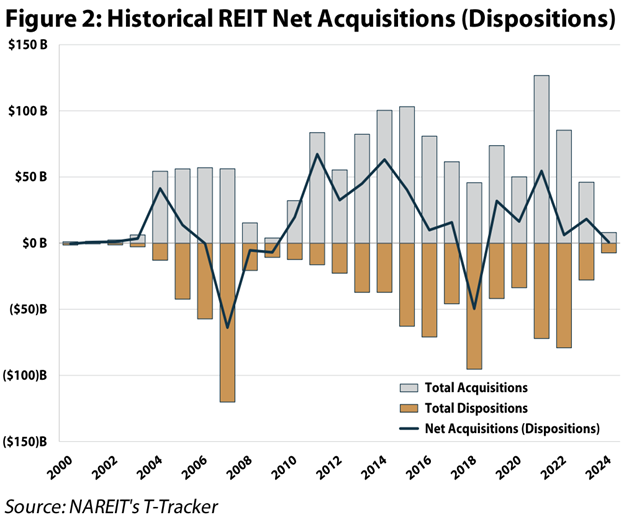
Following a nearly four-year period of NAV discounts due to the rise of tech stocks in the dot-com boom (sound familiar?), REITs then traded at an NAV premium for almost five years straight due to the above average growth in reported earnings and a significant rise in investor interest in commercial real estate that lifted valuations to then record levels! Again, the equity market cap of REITs soared from $151 billion at the end of 2002 to over $400 billion in 2006. During this time, we calculate that REITs executed net acquisitions of $59 billion, raising over $53 billion in new equity.
–
Public REITs were again competitors for most large high-quality properties coming to market given their management expertise and favorable cost of capital versus private peers. Though there were fewer IPOs than in the 1990’s, equity REITs raised significant equity capital on the secondary market resulting in portfolio growth, and investors rewarded them with premiums, resulting in +23% annualized total returns from 2002-2006. The biggest examples include Simon Property Group’s (NYSE: SPG) purchases of iconic properties such as the Houston Galleria and Pennsylvania’s King of Prussia Mall, in addition to company acquisitions of Chelsea, Prime, and Mills. Perhaps the most successful trade was executed by Sam Zell at Equity Office Properties. The company went on a string of acquisitions from 1998 to 2006, expanding its balance sheet by almost $13 billion, and sold to Blackstone at the peak in 2007 for $39 billion.
–
Following the Global Financial Crisis, public REITs had a few small windows of NAV premiums where they were able to secure several high-profile deals, including BXP’s acquisition of the GM Building (now the most valuable office building in the world) and AVB/EQR’s acquisition of the Archstone apartment portfolio for $5 billion.
–
2010 – 2024, the Acquisition Ice Age
However, as previously mentioned, the market has been less willing to assign a premium to public REITs in the past 14 years. In fact, the price/NAV for public REITs averaged 96.3% from December 2010 to July 2024, equivalent to a 3.7% discount. During this period (Figure 2), REITs made net acquisitions of $371 billion, concentrated in several sectors that had extended periods of NAV premiums, such as industrial, cell towers, data centers, cold storage, self-storage, triple net, and single-family rentals. Despite the lack of a broad cost of capital advantage over private players, public REITs delivered an annualized total return of +8.1% from December 31, 2010 to July 31, 2024.

–
Most of the high-profile deals were instead bought by private equity due to higher debt ratios that produced a WACC that was much lower than public REITs. For example, since 2010 Blackstone (NYSE: BX) has grown its real estate platform from $33 billion to $337 billion as of December 31, 2023. In fact, the cost of capital had become so different between public and private that 21 public REITs went private for a total of $141 billion from 2017 to present day. Notably, BX was the buyer of 8 of these public REITs for a total of $58 billion. The signals changed such that public REITs were usually punished by acquisition and equity raise announcements. As a result, public REITs used the capital markets to pay down debt to record low levels and, to a lesser extent, buy back stock, eschewing external growth save for a few sectors and companies.
–
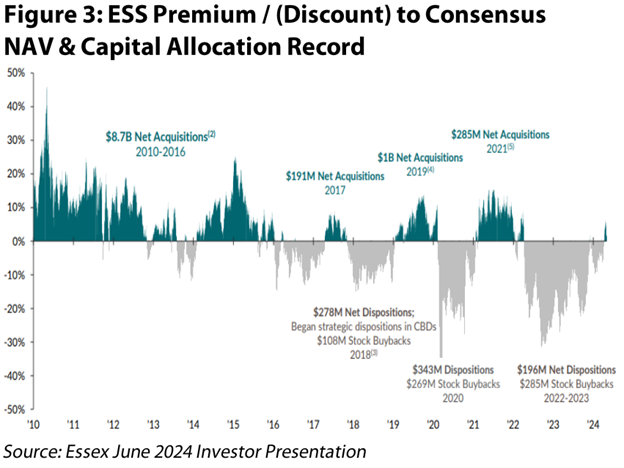
For example, Essex Property Trust (NYSE: ESS), a West Coast focused multifamily REIT, was aggressive in acquisitions from 2010-2016 when it was trading at a premium to NAV, making $8.7 billion in net acquisitions. As shown in Figure 3, the company had net dispositions of $87 million in 2017-2018, and repurchased $108 million of stock. After a brief period at an NAV premium in 2019 where it made $1 billion in net acquisitions, it has had $254 million in net dispositions since 2020, making $554 million of stock buybacks along the way. While the company could have made the numbers work by using cheap debt from 2017-2024, it instead prioritized a fortress balance sheet, garnering a BBB+ rating from S&P, and a debt ratio of only 28% as of June 30, 2024.

–
The ‘X’ Factor for the Next Decade
We believe ESS and the rest of the REITs have put themselves in position to be the winners of the next cycle. Due to disciplined capital allocation across all property types, public REITs boast an average debt / gross assets ratio of 32%, net debt to EBITDA ratio of 4.5x, and retained cash flow of 26% of AFFO as of June 30, 2024. If and when their stock prices trade at an NAV premium for an extended period, they will be ready to pounce.
–
This is already starting to occur in several property types, as public REITs have been buyers of some of the largest deals in 2023-2024. For example, triple net REIT VICI Properties (NYSE: VICI) bought BX’s stake in MGM Grand/Mandalay Bay for $1.2 billion in 2023, and has continued its buying spree through investments in the Venetian, Bowlero, and Chelsea Piers. Public Storage (NYSE: PSA) bought Simply Storage for $2.2 billion from BX in 2023 without having to raise any new equity due to its extremely low leverage and favorable borrowing rates. Senior Housing REIT Welltower (NYSE: WELL) has purchased $9.4 billion of senior housing assets since 2021, and has produced an annualized total return of 13.8% over the same period (compared to the RMZ’s annualized total return of -3.5% over the same time period) as investors cheered these accretive acquisitions.
–
Other sectors are still waiting. This year, the winning bidder on the assets in the Quarterra apartment portfolio from Lennar was KKR and other private equity owners, totaling approximately $4 billion. Brookfield Properties bought an industrial portfolio from DRA Advisors for $1.3 billion in June 2024. In a different market, these properties would be logical targets for apartment and industrial REITs, respectively.
–
As of July 31, 2024, estimates call for expected AFFO growth of +5%, and +6% in 2025 and 2026, respectively. However, if REITs were able to make acquisitions at a 150 bps spread that equated to 5% of their total market cap annually, it would add 150 bps to annual AFFO growth, resulting in enhanced annual growth around +7%.
–
As active managers, we have the ability to select REITs with even more upside. For example, Camden Property Trust (NYSE: CPT) is a top three overweight position in the Chilton REIT Composite as of July 31, 2024. CPT traded at an average NAV premium of 6.7% from 2003-2006. As of July 31, 2024, the company trades at a 17% discount to NAV. Merely assuming CPT trades in line with its NAV would reward investors with a 20% price return. If it were to trade at its average premium from the early 2000’s, there is 28% upside to the stock. Furthermore, we believe CPT has the ability to grow same-store NOI through strong organic growth that could approach +6.1% (2026: +4.3%, 2027: +8.0%) annualized from 2026-2027, plus make significant acquisitions or ramp its development pipeline given its low leverage balance sheet at only 21% debt / gross assets.
–
Conclusion
Recency bias has proven to be costly for those who did not anticipate interest rates would rise at a record pace in 2022 and 2023. While we can’t predict what the next cycle will look like and who the beneficiaries will be with any certainty, it should be different than the prior cycle. In an uncertain economic environment, we believe that the astute balance sheet management in the past has perfectly positioned many of the equity REITs for the current environment where strong management and access to multiple sources of low-cost capital relative to private players should allow many to play a much larger role in commercial real estate across all sectors.
–
Matthew R. Werner, CFA
mwerner@chiltoncapital.com
(713) 243- 3234
Bruce G. Garrison, CFA
bgarrison@chiltoncapital.com
(713) 243-3233
Thomas P. Murphy, CFA
tmurphy@chiltoncapital.com
(713) 243-3211
Isaac A. Shrand, CFA
ishrand@chiltoncapital.com
(713) 243-3219
–
RMS: 2,891 (7.31.2024) vs. vs. 2,727 (12.31.23) vs. 3,177 (12.31.2021) vs. 1,433 (3.23.2020)
–
An investment cannot be made directly in an index. The funds consist of securities which vary significantly from those in the benchmark indexes listed above and performance calculation methods may not be entirely comparable. Accordingly, comparing results shown to those of such indexes may be of limited use.)
The information contained herein should be considered to be current only as of the date indicated, and we do not undertake any obligation to update the information contained herein in light of later circumstances or events. This publication may contain forward looking statements and projections that are based on the current beliefs and assumptions of Chilton Capital Management and on information currently available that we believe to be reasonable, however, such statements necessarily involve risks, uncertainties and assumptions, and prospective investors may not put undue reliance on any of these statements. This communication is provided for informational purposes only and does not constitute an offer or a solicitation to buy, hold, or sell an interest in any Chilton investment or any other security. Past performance does not guarantee future results.
Information contained herein is derived from and based upon data licensed from one or more unaffiliated third parties, such as Bloomberg L.P. The data contained herein is not guaranteed as to its accuracy or completeness and no warranties are made with respect to results obtained from its use. While every effort is made to provide reports free from errors, they are derived from data received from one or more third parties and, as a result, complete accuracy cannot be guaranteed.
Index and ETF performances [MSCI and VNQ and FNER and LBUSTRUU] are presented as a benchmark for reference only and does not imply any portfolio will achieve similar returns, volatility or any characteristics similar to any actual portfolio. The composition of a benchmark index may not reflect the manner in which any is constructed in relation to expected or achieved returns, investment holdings, sectors, correlations, concentrations or tracking error targets, all of which are subject to change over time.