An Interesting Time to Invest in REITs | May 2024
Unfortunately for REIT investors, REIT prices have yet to decouple from movements in long term interest rates – and rates are rising again in 2024 as of April 30. Because real estate typically generates a steady (and growing) yield, there has historically been a playbook that REIT prices should trade down when rates are rising, and vice versa. We have spoken about this numerous times, debunking the theory based on interest rate movements in the 1990’s and 2000’s; however, since 2010, it has clearly worked over short term periods.
–
The degree to which REITs should move with rates is up for debate, as well as the ideal time to buy REITs while rates are rising. In a perfect world, one could predict the peak for interest rates and buy REITs as rates declined, followed by a timely sale at the trough of interest rates. In practice, this is nearly impossible.
–
Furthermore, recent economic data has pushed back timing of the first rate cut by the Federal Reserve (‘Fed’), and investors are coming around to the potential reality that higher rates are going to persist for an extended period. If this is true, why should anyone buy REITs?
–
Our research suggests that investors that have been brave enough to buy REITs when the rate outlook was at its worst have been handsomely rewarded. In addition, a decline in rates is not needed to achieve double digit annual total returns for REITs – rates merely need to stop rising. Though we cannot predict the peak of interest rates for this cycle, we believe that REITs are on the cusp of a multi-year bull market driven by better-than-expected economic growth, muted new construction, competitive advantages, and the stabilization (and potential decline!) of interest rates.
–
History of REITs and Rates
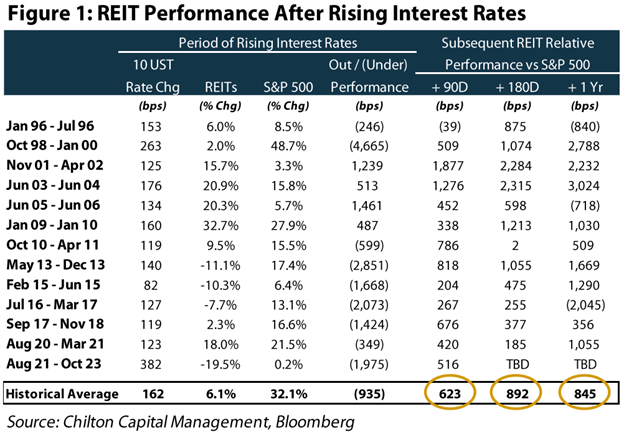
As shown in Figure 1, there were seven periods where the 10 yr Treasury yield rose more than 100 basis points (bps) from 1996-2011. In them, REITs produced a positive total return every time, and outperformed the S&P 500 in four of the seven periods. After the 10 yr Treasury yield stabilized or fell, REITs continued to significantly outperform the S&P 500 for the next 90-, 180-, and 365-day periods. These periods were characterized by economic growth, where the Fed was raising rates to cool growth and prevent inflation.
–
–
From 2013 to 2023, there were six periods where the 10 yr Treasury yield rose 75 bps or more. REITs produced a positive total return in two of the six periods, and underperformed the S&P 500 in all six – a drastically different outcome than the previous 15-year period. While the economy was growing off of a low base from 2009, the growth was relatively anemic, and inflation was persistently below the Fed’s 2% target. Instead, from 2013-2018, interest rates were slowly rising due to the rolling off of government bond-buying stimulus, and in anticipation of rate to give the Fed the ability to cut if need be. In other words, without commensurate inflation, the increases in the 10 yr yield resulted in increases in the real yield (nominal yield minus inflation), a phenomena clearly bad news for commercial real estate.
–
For the most recent two periods of rising interest rates, REITs have underperformed. While the total return was positive from August 2020 to March 2021, we argue that this was coming off of the record low for the 10 yr Treasury yield, and coincided with the largest stimulus this country has ever seen. The most recent period (August 2021 to October 2023) had the largest increase in the 10 yr Treasury yield, and also largest underperformance of REITs vs the S&P 500. So, after such a large decline in prices and increase in the 10 yr Treasury yield, what will follow?
–
Yield Spread Indicator
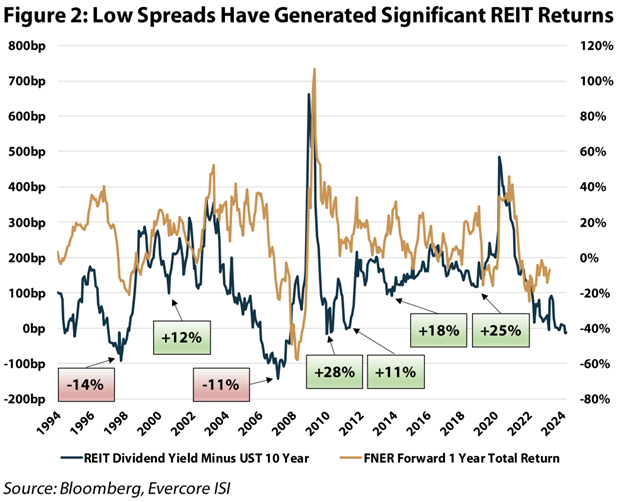
Delving a bit deeper, the reason for the changes in REIT prices as a result of changes in the 10 yr Treasury yield is that investors believe there should be a relationship between the yield on REITs and the 10 yr Treasury yield such that they move together (higher yield means lower prices, and vice versa). Thus, we track the ‘spread’, or the difference between the REIT dividend yield and the 10 yr Treasury yield, as one way to determine if they are undervalued or overvalued relative to the ‘risk-free rate’ (10 yr Treasury yield).
–
The historical average spread between the REIT dividend yield and the 10 yr Treasury yield has been 129 bps. This makes sense as there is more risk in an equity position than a bond from the US Government. However, there is also growth implied in the REIT yield versus no growth in yield from the Treasury bond. In theory, if the spread is wider than the historical average, then either REIT prices should rise (lower yield) or the 10 yr Treasury yield should increase to get back to the historical average.
–
There are several flaws with this relationship. First, it doesn’t account for changes in dividend growth rates. If dividends are projected to increase, then the spread should be lower than the historical average to reflect higher dividends in the future. We are in such a position today. Second, yield can be manufactured. We have spoken about this at length, but ‘all yield is not created equal’. Put simply, a 5% dividend from a company that is paying out 100% of its cash flow is not the same as a 5% from a company paying out only 70%.
–
As of April 30, 2024, the REIT dividend yield was about 30 bps lower than the 10 yr Treasury yield at 4.66%. Conversely, the public REIT weighted average payout ratio was at 72%, which compares to the ~85% payout ratio seen in 2007 and years prior. Thus, if we adjust for today’s lower payout ratio, the more comparable spread would be a positive 45 bps as of April 30, which helps to explain why the spread has been able to remain below the historical average for the past two years. In addition, as shown in Figure 2, we have found that low spreads have actually generated significant returns for the brave investors willing to jump in when REITs have appeared overvalued relative to the 10 yr Treasury yield.
–
–
Higher Rates Can Mean Higher Returns
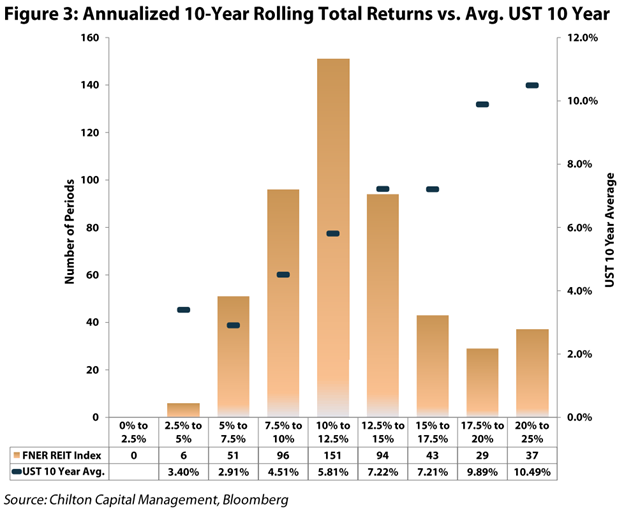
If rates can stabilize, albeit at a higher level, it is not all bad for public REITs. In fact, our research shows that it has led to higher 10 year rolling returns versus periods of low rates. As shown in Figure 3, the 10 year rolling returns were highest when the 10 yr Treasury yield averaged the highest rates over the corresponding period.
–
–
The reasoning for this is not intuitive, but we would point to the periods between 2007-2017 as an example of why lower rates actually don’t equate to higher returns. The zero-interest policy enacted by the Fed to stimulate the economy gave a cost of capital advantage to high leverage private real estate investors, leaving few opportunities for accretive acquisition or development for the public REITs. In contrast, higher borrowing rates gradually level the playing field between the public and private players and ultimately provide public REITs with a significant advantage due to lower blended capital costs, especially when the cost of equity is lower for public REITs.
–
In essence, the business model for public REITs is far superior today. We believe the next 10 years will be a much different world where public REITs’ share of the market will grow dramatically at the expense of private sources. As such, public REITs should not be ignored, but rather embraced for the structural advantages that come from navigating multiple cycles since the modern REIT era began in 1991.
–
Supply and Demand
Another reason for the success of public REITs during periods of higher 10 yr Treasury yields would be the strength of the economy, especially on a nominal basis. Given that REITs are beneficiaries of inflation through higher rents, revenue tends to rise the most during periods of high interest rates. In addition, better job growth and strong retail sales help drive occupancy.
–
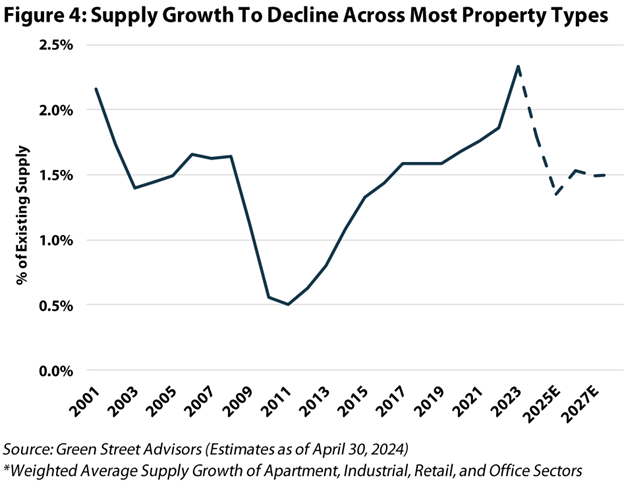
Furthermore, high borrowing costs make it much more difficult for new construction to pencil. As shown in Figure 4, new construction is “falling off of a cliff” across all property types. Even with rent growth over the past few years, construction costs have risen much faster. Banks are also not in a place where lending for new development makes sense as their cost of capital has risen dramatically, not to mention heightened scrutiny by regulators. To quote a REIT executive, ”…the capital market for real estate is frozen.” Combined with a strong economy, the supply/demand picture looks extremely attractive for the next 3-5 years.
–
–
Even if job growth slows as a result of higher rates, forcing the Fed to cut, consensus is still calling for the Fed Funds rate to settle in at 4.0% by the end of 2025, which we believe will not be enough to entice private developers to start construction at scale anytime soon. Therefore, we see little downside to our supply/demand outlook.
–
Data Dependent Fed
Federal Reserve Chairman Jerome Powell has been consistent that interest rate decisions made by the committee will remain “data dependent.” In other words, any changes in the Fed Funds Rate will come only after the committee is comfortable that enough data has been collected to make proper decisions. After waiting too long to begin raising interest rates, the Fed embarked on the most aggressive rate hiking cycle in US history during much of 2022 and 2023. In addition, the Fed began to wind down the size of its post-COVID balance sheet by reducing its holdings of Treasury bonds and mortgage-backed securities, putting further upward pressure on interest rates.
–
The Fed is most likely done hiking rates this cycle. The Fed’s own ‘dot plots’, or the median projection of each Fed officials’ estimate of future interest rate policy, would suggest three rate cuts in 2024 (and several more cuts in subsequent years). Market expectations on the other hand are more ‘hawkish’ for 2024. Futures markets are pricing in just one or two cuts this year, down from an expected five or six just a few months ago. Like the dot plots, futures markets would still suggest additional rate cuts over the next several years. However, to get comfortable in actually cutting rates, the Fed still needs to see more progress on the inflation front. Namely, the Fed wants to see inflation closer to its long-term goal of 2%.
–
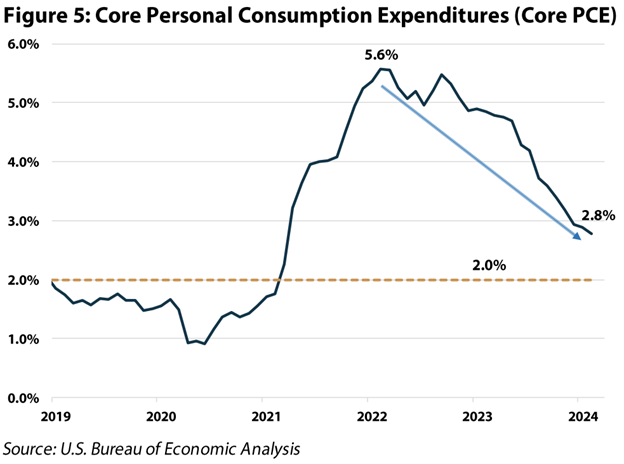
Monetary policy conducted by the Fed is dictated by its dual mandate of keeping prices stable and maximizing employment. While the Fed analyses a number of economic indicators to determine interest rate policy, the Fed’s preferred measure of inflation is Core Personal Consumption Expenditures (or Core PCE). The core index excludes the volatile food and energy categories to more easily track the underlying inflation trend in the US economy. As shown in Figure 5, this inflation metric peaked in February 2022 at 5.6% and has moved lower to 2.8% as of March 2024. While this data is moving in the right direction, the recent pace of improvement has been disappointing. For the Fed to begin cutting rates, this measure doesn’t necessarily have to hit 2%, but it certainly needs to approach that level.
–
–
Not only does inflation need to continue to move lower, but other measures of economic growth also need to deteriorate. Primarily, indicators such as the unemployment rate, private payrolls, initial jobless claims, job openings, and average weekly earnings would have to cool. In addition, other measures such as retail sales, industrial production, construction spending, and home sales also need to slow. Given the unprecedented rise in interest rates over the past couple of years, it is likely that most of these measures will decline over the next few years. Though the timing is uncertain, this should give the Fed the ammunition it needs to begin its rate cutting campaign.
–
Chilton Positioning
Historically, the best performing property types during times of rising interest rates have been malls, office, multifamily, data centers, self-storage, industrial, and lodging. Conversely, the biggest underperformers were healthcare, shopping centers, triple net, and cell towers. As of April 30, 2024, the Chilton REIT Composite is constructed to do well if interest rates remain high, and should keep up with the benchmark should interest rates decline. As such, our biggest sector overweights are cell towers, residential, and now even healthcare as it is positioned to generate above average growth over the next several years. Going forward, we are biased towards increasing our exposure to self-storage and residential REITs as fundamentals turn and interest rates stabilize.
–
In summary, we believe anyone that is hoping (praying) for lower interest rates anytime soon could be setting themselves up for disappointment. However, if interest rates can stabilize, albeit at a higher level than the past 15 years, REITs in general can do quite well. And, we believe Chilton is positioned to outperform in such a scenario.
–
Matthew R. Werner, CFA
mwerner@chiltoncapital.com
(713) 243- 3234
Bruce G. Garrison, CFA
bgarrison@chiltoncapital.com
(713) 243-3233
Thomas P. Murphy, CFA
tmurphy@chiltoncapital.com
(713) 243-3211
Isaac A. Shrand, CFA
ishrand@chiltoncapital.com
(713) 243-3219
–
RMS: 2,527 (4.30.2024) vs. 2,727 (12.31.2023) vs. 2,398 (12.31.2022) vs. 3,177 (12.31.2021) vs 1,433 (3.23.2020) and 2,560 (2.21.2020)
–
An investment cannot be made directly in an index. The funds consist of securities which vary significantly from those in the benchmark indexes listed above and performance calculation methods may not be entirely comparable. Accordingly, comparing results shown to those of such indexes may be of limited use.)
The information contained herein should be considered to be current only as of the date indicated, and we do not undertake any obligation to update the information contained herein in light of later circumstances or events. This publication may contain forward looking statements and projections that are based on the current beliefs and assumptions of Chilton Capital Management and on information currently available that we believe to be reasonable, however, such statements necessarily involve risks, uncertainties and assumptions, and prospective investors may not put undue reliance on any of these statements. This communication is provided for informational purposes only and does not constitute an offer or a solicitation to buy, hold, or sell an interest in any Chilton investment or any other security. Past performance does not guarantee future results.
Information contained herein is derived from and based upon data licensed from one or more unaffiliated third parties, such as Bloomberg L.P. The data contained herein is not guaranteed as to its accuracy or completeness and no warranties are made with respect to results obtained from its use. While every effort is made to provide reports free from errors, they are derived from data received from one or more third parties and, as a result, complete accuracy cannot be guaranteed.
Index and ETF performances [MSCI and VNQ and FNER and LBUSTRUU] are presented as a benchmark for reference only and does not imply any portfolio will achieve similar returns, volatility or any characteristics similar to any actual portfolio. The composition of a benchmark index may not reflect the manner in which any is constructed in relation to expected or achieved returns, investment holdings, sectors, correlations, concentrations or tracking error targets, all of which are subject to change over time.