
Shopping Center REITs: Undervalued Despite Growth Ramp | September 2025
For many investors in the past decade, e-commerce growth relegated brick and mortar retail to an un-investable world on a gradual death march. Some viewed the “COVID” e-commerce surge of 2020-21 as the “nail in the coffin”; instead, it proved the essential nature of physical locations in an omnichannel world. Indeed, Target (NYSE: TGT) touts ~40% savings for in store fulfillment versus dedicated distribution centers and, unsurprisingly, fulfilled ~98% of merchandise sales (including online sales) through a physical store in 2024. This sea change is common with most big box retailers today, and it has meaningfully increased the demand for well-located space. As a result of the higher demand combined with minimal new supply, retail vacancy hovers around historic lows. We believe that vacancy can decline further to new record lows, leading to higher rents and underappreciated earnings growth for Shopping Center REITs.
–
In our 2024 update, although we expected robust rental growth, we remained cautious due to the capital spending required to capture the upside (leasing commissions, tenant build-out costs, timing delays etc.). While caution was warranted (see below for more discussion on Bed Bath & Beyond’s bankruptcy), leasing delivered meaningfully better results than expected. Indeed, rental increases exceeded our expectations but, more importantly, downtime was shorter than feared and leasing costs were lower than expected. As a result, landlords commenced the majority of vacant spaces in early 2025 at much higher rents than what Bed Bath & Beyond was paying. Furthermore, the new tenants provided better credit and drive stronger traffic to the centers. Despite this success, public shopping center REITs are roughly flat over the past year, leading to a more attractive valuation despite the meaningfully improved outlook.
–
All told, we believe shopping center REITs are poised for a multi-year runway of outsized total returns, and we have increased our exposure based on 1) record low vacancy supporting rental growth, 2) a manageable tenant watchlist, 3) public REITs trading 7% below private market values, 4) current construction costs are materially above public REIT valuations, 5) accretive acquisitions opportunity bolstering growth, and 6) a discounted price to funds from operations (P/FFO) multiple despite a strong growth profile. While this fundamental improvement has been underway for some time now, we believe the catalyst of institutional capital returning to the space could drive a re-rating of the stocks.
–
Chilton Positioning
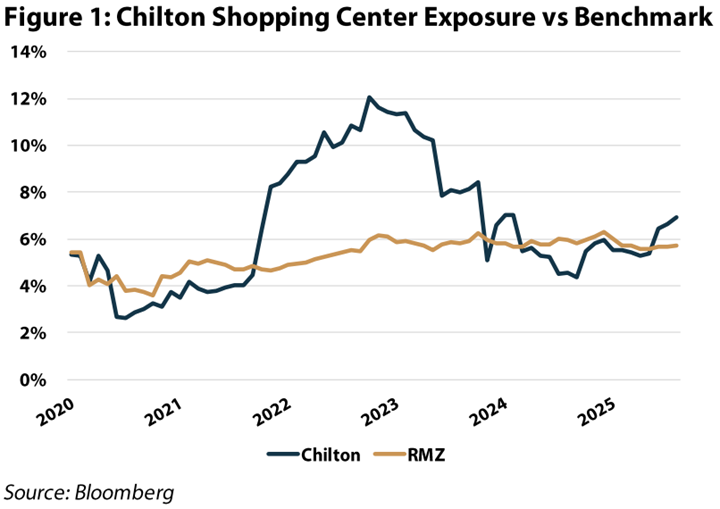
Figure 1 highlights our shopping center exposure relative to our benchmark – the MSCI US REIT Index (Bloomberg: RMZ).
–
–
We own three shopping center REITs as of August 31, 2025 that we believe are poised to outperform from the above-mentioned positive trends:
–
InvenTrust Properties (NYSE: IVT) owns a high-quality portfolio of grocer anchored centers across the Sunbelt. The company retains a respected management team, low leverage, and a portfolio mix between anchor and small shops conducive to higher growth. The recent disposition of the California assets for over $300 million provided flexibility to enter higher growth markets in the Southern states which now approach 100% of invested assets. Finally, we believe the company’s attractive portfolio and size makes it a takeout candidate.
–
Brixmor Property Group (NYSE: BRX) spent the better part of the past decade pruning and selectively redeveloping their portfolio. We believe the end result is a materially stronger asset collection that is still underappreciated in the market. Additionally, while BRX had some of the highest exposure to recent bankruptcies, we believe the company’s leasing success portends some of the strongest growth in the space over the coming years.
–
Whitestone REIT (NYSE: WSR) presents more of a special situation within our shopping center exposure. Management has pruned the legacy portfolio into what we view as a quality set of assets across Arizona and Texas. It is differentiated within the peer group due to its mix of 23% anchor tenants versus 77% small shops (by annualized base rent, or ABR). Additionally, the company has made significant progress on some self-inflicted headwinds. Notably, net debt to EBITDA has declined by over 2 turns in the past ~4 years, the dividend has been reset at a reasonable payout ratio, and a lawsuit based on a subsidiary bankruptcy is set to be resolved in the near term. Notably, upon resolution of the lawsuit, we expect WSR to receive cash proceeds in the range of $40-$50 million ($0.85 per share at the midpoint), which can be used to make accretive acquisitions, pay down debt, or buy back shares. Highlighting the discount in the shares, WSR spurned a takeout offer last year at 14% premium to its price as of August 31, 2025.
–
Fundamental Backdrop
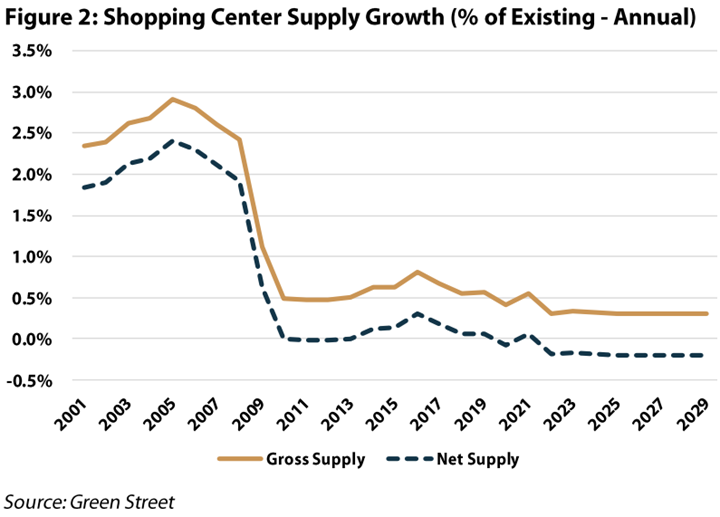
As we have reported in the past, new supply of shopping centers was almost nonexistent over the past 15 years, and we see few signs this changes in the foreseeable future. Shown in Figure 2, new construction has averaged just 0.5% of existing supply since 2010. Considering that typical obsolescence in commercial real estate is ~0.5% to 1.0% of existing supply per year, that the net change in shopping center supply has been flat to down for 15 years. More importantly, based on forecasts from Green Street Advisors, supply additions are estimated to be 0.3% annually for the coming years – suggesting that at our assumed obsolescence level, net supply could actually decline in the coming years.
–
–
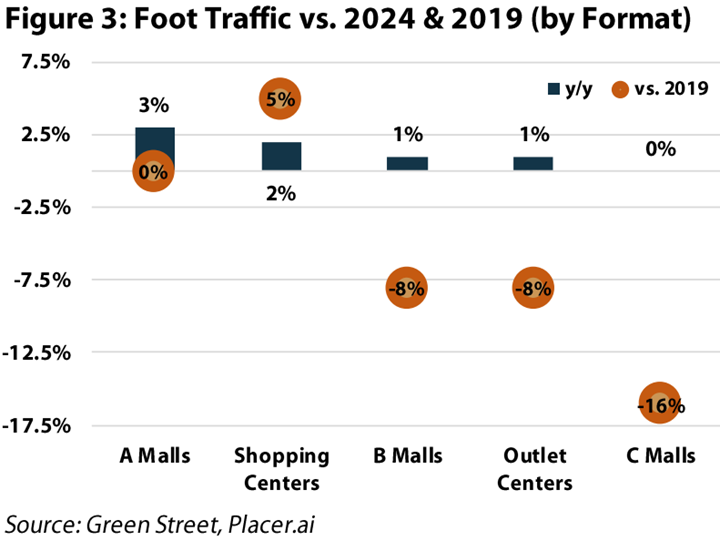
This supply backdrop is complemented by a demand uptick as retailers recognize the fundamental need for brick-and-mortar spaces within their omnichannel strategies. Recently, consumer fears have dominated headlines and driven some choppiness. Retail was one of the harder hit property types in the immediate aftermath of liberation day (April 2, 2025), as investors feared tariff induced inflation would be too much for an already stretched consumer. This was demonstrated by a sharp decline in consumer sentiment. However, other metrics tell a more positive story – no major cracks in the labor market, retail sales are still positive, and foot traffic to centers remains encouraging. Highlighted below (Figure 3), foot traffic at open air shopping centers is up 2% in 2025 and sits 5% above 2019 levels. Notably, they are the only retail format with foot traffic above 2019.
–
–
Tenant Fallout
After a flurry of smaller bankruptcies in 2020, the shopping center group experienced historically low filings in 2021-2023. This was punctuated when Bed Bath & Beyond filed in April 2023. While a major tenant bankruptcy is a negative headline, we can point to several examples as to why this was a positive for shopping center REITs.
–
First, some Bed Bath & Beyond leases were assumed by better retailers, which provides landlords with no downtime and the potential for a rent increase upon expiration. In Winter Park, FL, Bed Bath & Beyond had a ~29,000 sqft space with rent of just $8.26/sqft and three 5-year tenant extension options after the initial expiration in January 2028. Considering the average asking rent in Orlando is ~$25/ft (and Winter Park is arguably the most attractive submarket), it is not surprising Macy’s (NYSE: M) paid $1.2 million to creditors to secure this lease for a new Bloomingdales location. Burlington (NYSE: BURL) was a prolific buyer of Bed Bath and Beyond leases, purchasing a total of 50 leases for almost $14 million through auctions and negotiated sales (to be clear the payment is made to creditors, the landlord simply continues collecting rent from the buyer without any changes to the lease).
–
In cases where the landlord buys the lease or takes back the space, they have the ability to sign a new tenant at a higher price. Obviously, this comes with downtime and capital commitment to the new tenant space, but these can create positive value in certain cases. Taking Brixmor as an example, of the 11 Bed Bath & Beyond and 3 Buybuy Baby boxes, BRX ultimately achieved releasing spreads of +37%, with the majority of the rent already commenced. New users range from specialty grocers (Trader Joes, Sprouts) to home/value retailers (Wayfair and others). Most importantly, BRX was able to refill the majority of the spaces with single users (e.g., no splitting the box) – with build-out costs approximating $50/sqft. Considering prior rents just above $10/sqft, on a per square foot basis, BRX spent $50 to achieve a $4-5 uplift (implying an 8-10% yield on cost). On top of this solid yield, we would further note that starting rental rates grow throughout the lease (likely 2-3% annually for these boxes).
–
As the REITs successfully released the Bed Bath & Beyond spaces, the next round of tenant fallout arrived in late 2024 with Big Lots, Joann, and Party City. Fortunately, we are seeing similar results to the Bed Bath & Beyond experience. Kimco (NYSE: KIM) and BRX were the two REITs most exposed, and, as of early 2025, already addressed 75% of the space at rent spreads above 40%. As it stands today, the tenant watchlist includes an array of retailers – Regal/AMC, CVS/Walgreens, PetSmart/Petco, Kohls/Macy’s, Michaels, and others. Given the breadth of retail categories in the watchlist and the fact that the majority are facing operational challenges rather than imminent bankruptcy, we view the current outlook favorably relative to historic norms. While we continue to assume typical fallout in our models, we think another period of negligible filings could further bolster 2026-28 growth for the sector.
–
Private Market Values
Elevated interest rates have kept transactions subdued in recent years, but recently, activity levels are heating up with YTD shopping center sales 35% higher than the same period in 2024. More impressive, transactions over $100 million have nearly doubled relative to 2024 (up from $470 million to $870 million). Many of the larger transactions have included institutional buyers, growing from just 8% for 2024 to 36% thus far in 2025. Blackstone’s (NYSE: BX) deal to take Retail Opportunity Investments Corp (NYSE: ROIC) private at a 34% premium in 2024 was the clear highlight, but more recently, GIC (the Singapore sovereign wealth fund) joined with Kite Realty (KRG) in a $750M acquisition in Texas. Finally, we see fund raising activity continuing with the latest example being Nuveen, which raised $320 million for its US Cities Retail Fund. As of August 31, 2025, the gap between private and public market shopping center valuations stands at 7%. We believe that it is only a matter of time before the private market interest in shopping centers moves to the public market to close the gap.
–
Replacement Costs
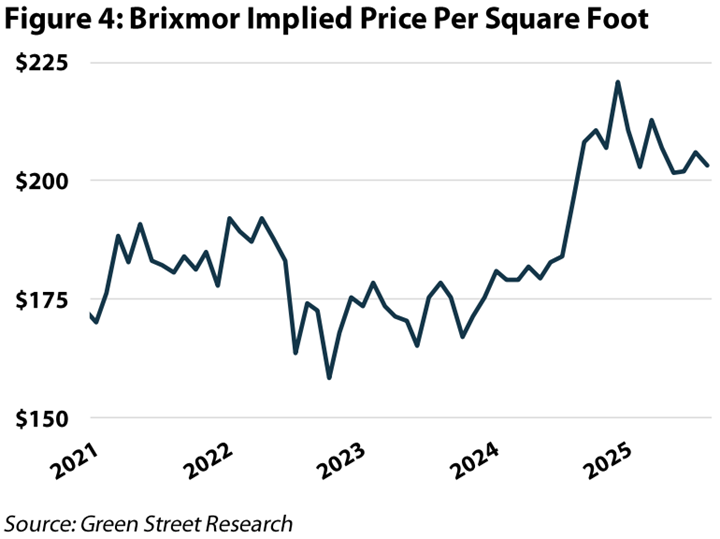
While specifics vary by market, land prices and construction costs are up markedly since 2019. Based on channel checks, if we were judging the economics for a new development, we would assume ~$200/sqft of building costs, ~$75/sqft for tenant buildout, and another ~$20-30/sqft for soft costs (mainly interest carry). This means, before even considering the land component, all in building costs for a new retail site would run roughly $300 per square foot. Land prices are a lot harder to pin down with specificity, but they tend to range between 15-20% of total project costs, so we could conservatively assume another $50/sqft – bringing the total project to $350/sqft. For comparison, Brixmor is only trading at an implied value per square foot of ~$203 (Figure 4).
–
–
Improved Growth Profile
Historically, public REIT investors had thought about shopping centers as a 2-3% normalized growth story. Ignoring the fundamentals ramp for a second, we believe several important changes have improved the normalized growth level (e.g., occupancy neutral growth rate). First, landlords shifted most small-shop tenants to fixed common area maintenance (CAM) – things like landscaping, security, snow removal, and other routine maintenance. A fixed model adds simplicity, but, benefitting from economies of scale, REIT landlords can also earn a modest margin (stronger cost control). Second, newly signed contracts include higher annual rent bumps. Finally, higher retention rates on existing tenants improves growth through less downtime and capital spending. In an occupancy neutral environment, we believe shopping center REITs can now drive same store net operating income (SSNOI) growth in the range of 3-4% (from 2-3% historically).
–
In the medium term, we expect occupancy gains to support even higher growth figures. BRX’s rule of thumb calls for 180 basis points (bps) of SSNOI uplift for every 100 bps of occupancy improvement. As of 2Q25, BRX’s physical occupancy stood at 89.7%, but, based on the exceptional releasing activity detailed above, the company’s leased occupancy stood at 94.2%. This represents a 450-bps signed not open (SNO) pipeline, which we view as a baked-in driver of upside in the coming years. Simply realizing this embedded occupancy over 3 years (we expect faster) provides almost 3% of annual SSNOI enhancement. Additionally, based on current leasing prospects we believe BRX (and the group at large) is poised to drive occupancy rates above prior record levels.
–
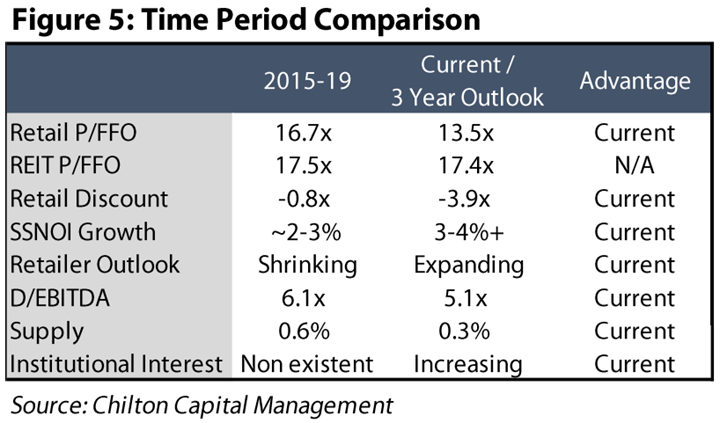
Valuation Disconnect
Based on current consensus, retail REITs sit at 13.5x 2026 FFO relative to the broader REIT average at 17.5x. This compares to the 2015-2019 period where retail REITs traded at ~17x FFO and the broader REITs traded at 17.5x. In other words, while shopping center REITs have historically traded at a 0.8x discount to the broader REIT group, today that discount has expanded to ~4x. Figure 5 below compares the characteristics of 2015-19 to today and the takeaway is clear: the shopping center multiple discount has expanded materially despite 1) stronger growth, 2) lower leverage, 3) less supply, 4) better retailer sentiment, and 5) improved institutional interest.
–
–
Conclusion
Shopping center REITs today stand at the intersection of stronger fundamentals, limited new supply, and a meaningful valuation disconnect. Leasing has been exceeding expectations, tenant fallout is being addressed with value-accretive outcomes, and the private market is providing supportive pricing evidence. Replacement rents, improved contractual structures, and low vacancy levels all reinforce higher earnings power relative to past cycles.
–
Across a variety of valuation methodologies, we come to a similar conclusion, shopping center REIT valuations are meaningfully underappreciating growth prospects. While this situation has been building for some time, we see two catalysts in the coming years. First, a period of normal tenant fallout should highlight the newfound earnings power for shopping center REITs. Second, we expect institutional capital’s growing interest in and appreciation for shopping centers to become increasingly apparent. A material NAV discount is easy to ignore when transaction activity is muted, but when assets are regularly trading well inside of public REIT valuations, we expect the market to take notice. As such, we have increased our exposure to shopping centers above the benchmark through positions in InvenTrust, Brixmor, and Whitestone.
–
Thomas P. Murphy, CFA
tmurphy@chiltoncapital.com
(713) 243-3211
Matthew R. Werner, CFA
mwerner@chiltoncapital.com
(713) 243- 3234
Bruce G. Garrison, CFA
bgarrison@chiltoncapital.com
(713) 243-3233
Isaac A. Shrand, CFA
ishrand@chiltoncapital.com
(713) 243-3219
–
RMS: 3,071 (8.31.2025) vs. 2,966 (12.31.2024) vs. 3,177 (12.31.2021) vs. 1,433 (3.23.2020)
–
An investment cannot be made directly in an index. The funds consist of securities which vary significantly from those in the benchmark indexes listed above and performance calculation methods may not be entirely comparable. Accordingly, comparing results shown to those of such indexes may be of limited use.)
The information contained herein should be considered to be current only as of the date indicated, and we do not undertake any obligation to update the information contained herein in light of later circumstances or events. This publication may contain forward looking statements and projections that are based on the current beliefs and assumptions of Chilton Capital Management and on information currently available that we believe to be reasonable, however, such statements necessarily involve risks, uncertainties and assumptions, and prospective investors may not put undue reliance on any of these statements. This communication is provided for informational purposes only and does not constitute an offer or a solicitation to buy, hold, or sell an interest in any Chilton investment or any other security. Past performance does not guarantee future results.
Information contained herein is derived from and based upon data licensed from one or more unaffiliated third parties, such as Bloomberg L.P. The data contained herein is not guaranteed as to its accuracy or completeness and no warranties are made with respect to results obtained from its use. While every effort is made to provide reports free from errors, they are derived from data received from one or more third parties and, as a result, complete accuracy cannot be guaranteed.
Index and ETF performances [MSCI and VNQ and FNER and LBUSTRUU] are presented as a benchmark for reference only and does not imply any portfolio will achieve similar returns, volatility or any characteristics similar to any actual portfolio. The composition of a benchmark index may not reflect the manner in which any is constructed in relation to expected or achieved returns, investment holdings, sectors, correlations, concentrations or tracking error targets, all of which are subject to change over time.


