
Data Center REITs: Own the Real Estate Behind AI | August 2025
There’s little question that artificial intelligence (AI) has created more wealth in the past five years than any other industry. The poster child for this secular growth trend is Nvidia (NASDAQ: NVDA), which has grown its revenues by over 5x in the 5 years ending December 2024, driving its share price up by a factor of 22x. A poll from June 2024 estimated that approximately 33% of Nvidia employees hold stock that is valued over $20 million! Nvidia’s proprietary GPU chips have become the gold standard for performing complex tasks that are needed by AI, and its customers (Microsoft, Meta, Apple, and Amazon to name a few) have shown an insatiable appetite as they position themselves for the AI revolution.
–
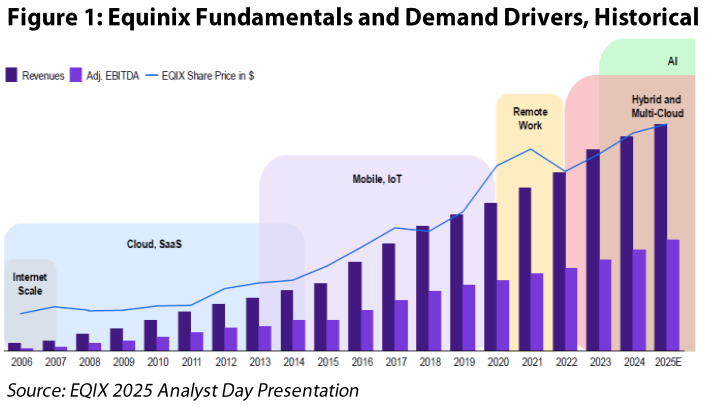
Though not reported on as much by the talking heads, these chips are housed in data centers around the world. Thus, similar to the revolution of ‘cloud computing’, the ‘boring’ real estate sector once again finds itself on the cusp of a secular growth trend of providing the infrastructure for a digital revolution, as shown in Figure 1. As a result, data center REITs produced a 77% total return in the five years ending December 31, 2024, or +12% annualized. The revenue and share price growth are nowhere near that of Nvidia, but impressive relative to the MSCI US REIT Index (Bloomberg: RMZ), which produced a +24% total return over the same period (+4% annualized).
–
–
Although hardly a week can go by without an announcement of a multibillion-dollar data center needed for AI, 2025 has been less than stellar for the data center REITs. First, a lot of the investment has come from end users such as Oracle, Meta, Microsoft, and Apple, preempting the need for a third-party landlord. Second, while the REITs have focused on prime locations, many of the new investments are in tertiary markets such as Abilene, Louisiana, Oklahoma, and Pennsylvania. We believe this is reminiscent of the onset of cloud computing, where some investors thought that the cloud would diminish the need for prime locations of third-party data centers, only for the market to regain confidence later as cloud companies became the largest tenants of data center REITs. While the path will not be linear, the AI revolution is something that we do not want to miss, and we believe investors will regain the same optimism over the coming years.
–
Data Center Refresh
Since our last outlook on data centers in February 2023, much has changed in the supply/demand dynamic. Historically, we favored ‘interconnected’ data centers (also called ‘network-dense’; prime locations with many internet service providers) due to the high barriers to entry, which delivered consistent rent growth. Periodically, we invested in ‘wholesale’ data centers (data centers with large tenants) through CyrusOne (taken private by KKR) and QTS (taken private by Blackstone) when we believed valuation had become too cheap. The thesis was based on high development yields for wholesale data centers eventually compressing, while rents at legacy wholesale data centers would languish due to persistent new supply.
–
However, the thesis began to change in late 2022 when power became scarce and more expensive; it became increasingly difficult to build data centers, putting a throttle on supply while demand continued to soar. Rent growth across the board became less negative, prompting us to initiate a position in Digital Realty Trust (NYSE: DLR) around $95 per share in October 2022, which compares to DLR’s July 31, 2025 closing price of $176 per share. DLR has a blend of interconnected and wholesale data centers, but most of the development was for wholesale data centers leased to the top technology companies in the world. We could not have foreseen what would happen next with the growth in demand due to AI, but it is fair to say that the data center industry was not prepared for a massive increase in demand due to their supply constraints, taking rent growth to levels it had not seen before.
–
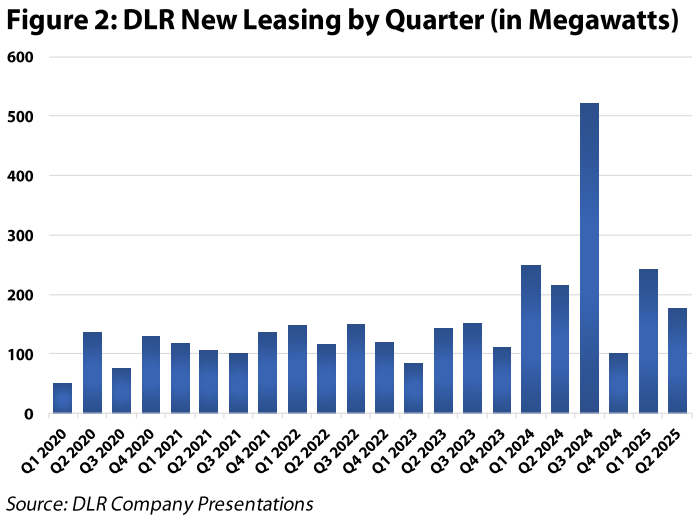
In 2023, Equinix (NASDAQ: EQIX) and DLR produced total returns of +25% and +40% respectively, followed by +19% and +36% in 2024. Both companies were far exceeding historical records for bookings in a single quarter, sometimes by a factor of two (see Figure 2)! While EQIX’s results were much smoother to the upside given its interconnected focus, DLR’s wholesale development business was booming. Furthermore, organic rent growth went from negative to positive to growing in the high single digits within 12 months in most markets. Some markets, such as Northern VA, saw rents double! Interestingly, the perception of ‘quality’ geographies changed from only the top markets (NY/NJ, Chicago, Northern CA, Northern VA) to include many secondary and even tertiary markets (Atlanta, Dallas, Ohio, Phoenix) due to two factors: 1) the lack of availability of power in top markets, and 2) AI demand did not necessitate proximity to an interconnected data center (for now).
–
–
As evidenced by DLR’s outperformance, it has largely been a ‘beta-driven’ move for data centers, as data center landlords of most types and geographies have found themselves in an extremely favorable supply/demand environment. EQIX has been able to push price increases to its customers as well, but the company also didn’t experience the many years of negative rent growth in the prior 5+ years, so the increases are not as sharp. Furthermore, EQIX’s development program is similar in size to DLR ($5 billion versus $6 billion), but a smaller percentage of its enterprise value than DLR (5% vs 15%) given EQIX’s larger base. Even so, EQIX’s total returns easily outpaced the MSCI US REIT Index (Bloomberg: RMZ) in 2023 and 2024. Heading into 2025, data centers seemed like a ‘sure-bet’ among REIT sectors.
–
2025 New News
The euphoria around AI and data centers didn’t last long in 2025. On January 27, 2025, DeepSeek, a Chinese AI company, released its R1 AI model globally with a reported training cost of only $6 million. For comparison, it is estimated that training GPT’s latest model 4 cost over $1 billion. This had sweeping implications for the entire industry; if training and using a powerful AI model consumed less power, then the anticipated exponential growth in demand for GPU chips and the data centers to house them could slow materially.
–
On January 27, NVDA’s stock plummeted 17%, erasing $589 billion in market cap, the largest single day loss for any company in history. Similarly, DLR and EQIX fell by 11% and 7% that day, respectively. Over the following days and weeks, doubts about the validity of the $6 million cost estimate surfaced, but the risk of increasing power efficiency remains.
–
In what was likely a response to the DeepSeek news, it was reported in March that Microsoft was pulling back from 2 gigawatts (GW) of planned data center commitments in the US, sending another ripple through the industry. DLR’s stock price declined by 10% from March 24-27 as investors questioned if this was part of a larger trend.
–
More recently, EQIX held its regular Analyst Day on June 25, which occurs every two years. As in the past, the four-hour event concluded with an estimate of long-term dividend, revenue, and adjusted funds from operations (AFFO) growth, in addition to capital expenditure requirements and anticipated leverage. Initially, the company projected that it’s ‘underlying’ annual AFFO per share growth through 2029 would be +8-11%, a positive development versus it’s 2023-2027 projection of +7-10%. However, the company anticipated that higher interest expense from refinancing of low coupon debt and new debt needed for annual capex of $4-5 billion (vs prior projection of $3 billion) would reduce annual AFFO growth by 1% per year. Furthermore, a new company initiative called ‘Build Bolder’, essentially a more aggressive development program, would further reduce AFFO growth by another 2% per year, bringing the actual AFFO per share growth estimate to +5-9%. This would also lower estimated annual dividend growth to +8% (from +10%) and increase leverage from 3.5x net debt/EBITDA to 4.5x net debt/EBITDA. The higher leverage and capex combined with lower AFFO and dividend growth collapsed the stock, sending EQIX down 18% over two trading sessions.
–
Chilton Assessment
As a result of the above events, EQIX has underperformed the RMZ by producing a YTD total return of -16%, while DLR is essentially inline at +1% as of July 31. As active managers, we can change allocations rapidly based on our assessment of stock price movements versus any changes to the thesis that may occur due to ‘new news’. It is important to note that data centers have long been a ‘battleground’ sector between REIT and generalist investors. While both types of investors have the similar goal of making money from investing in data center REITs, the approach, timeline, and investment universe differ. Generally speaking, REIT investors use metrics such as net asset value (NAV) and AFFO multiple, while generalists favor discounted cash flow (DCF) and EBITDA multiple – sidenote: we use a blend of our proprietary NAV framework and a DCF model. In addition, REIT investors likely have longer investment timelines given that data center REITs comprise over 12% of the RMZ, while they only comprise less than 0.3% of the S&P 500. The smaller weight in the generalist benchmark makes the sector easy to ‘rent’ for a few quarters or years before moving on to another sector. In contrast, REIT investors have a much higher risk of underperforming the benchmark if the sector is avoided for a long period. Finally, generalist investors have hundreds more stocks and many more sectors to choose from, allowing them to shift to other growth stories. Said differently, a 7% AFFO growth rate may sound much more attractive to a REIT investor who is comparing it to a 5% REIT AFFO growth average, versus a generalist who is comparing it a 10% S&P 500 earnings growth average.
–
We estimate that the data center REITs have among the highest percentage of their shareholder base comprised by generalist investors relative to other REITs. Thus, the stocks are prone to have reactions that are different than expected, which can create short term volatility and, as a result, buying opportunities for long term investors. The biggest change we made to the portfolio in the volatility surrounding Liberation Day was adding to DLR. From April 2 to July 31, DLR has produced a total return of +19%, making it a top 5 performer in the benchmark. We had the confidence to add to DLR at the time due to our conviction in the AI demand story, and the massive growth in data center capacity that would be needed, even as chips and AI models become more efficient.
–
Top or Bottom of the 1st Inning?
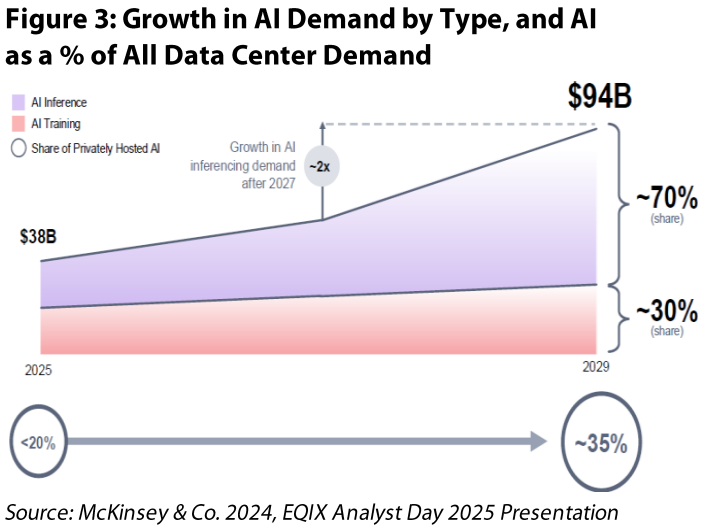
As with each new driver of demand (webpages, cloud, streaming, etc.), the adoption cycle takes time. McKinsey & Co estimates that AI comprises only 14% of global data center power capacity in 2025, but this could grow to over 35% by 2030 (Figure 3). We believe that the world is just scratching the surface of AI use-cases. Currently, most of the AI demand is coming from training. This requires thousands of GPU chips working non-stop for weeks or months to learn a large language model (LLM), which can then be accessed by users. There can be LLMs for everything from finance to law to compliance to documentation to literature.
–
–
As of today, a small percentage of EQIX and DLR in-place revenue comes from AI. Based on anecdotes from earnings calls, we believe DLR’s annualized revenue from lease bookings attributable to AI demand is less than 10% of the company’s annualized revenue as of 1Q 2025. While AI data center leasing revenue is estimated to total $38 billion worldwide in 2025, this number is estimated to grow to $94 billion in 2029 according to McKinsey, a compound annual growth rate of 25%. Thus, we believe that AI will comprise a much higher percentage of DLR’s revenue going forward. To give an example, the company didn’t sign its first major AI lease until 2Q 2024, and its record 3Q 2024 booking quarter of over $500 million in revenue had 50% attributable to AI. To put that in perspective, the AI leasing in 3Q 2024 alone would’ve set a quarterly record for the entire company’s history!
–
Inference: The Next Frontier of AI Evolution
While LLMs are limited by what has been uploaded, ‘inference’ workloads will be able to process and analyze information they have never learned before. Inference is poised to become the most impactful phase of AI evolution. Unlike training, which is compute-intensive but less latency-sensitive, inference demands both immense power and low-latency environments. According to McKinsey & Co, about half of the demand for AI data centers comes from inference today; however, by 2029, 70% of all AI demand will come from inference (Figure 3). The company estimates that the growth rate in inference demand will double in 2027. Examples of AI inference use cases include: autonomous driving, video generation, fraud detection, quality control, medical imaging, and customer service.
–
EQIX is poised to benefit more from the transition to inference than DLR due to the low latency requirement and EQIX’s higher concentration in interconnected data centers. As such, we actually are positive on EQIX’s plans to increase annual capex by 50% to $4.5 billion. According to the company, they are able to achieve stabilized yields of over 20%. When compared to a 6% cap rate at which these can be sold, the profit margin is a hefty 233%. Thus, we believe the company is doing the right thing to get ahead of the incoming demand wave that is set to inflect in 2027. Notably, the company disclosed that its AFFO growth rate will be at the high end of its +5-9% growth rate range toward the back half of its forecast. Finally, our analysis has also shown that many traditional data centers do not have the power and cooling capabilities to support the power-hungry GPUs needed for AI training and inference, which necessitates EQIX (and DLR) to develop new data centers to capture the demand.
–
Energy Governor to Supply
While new data center announcements have been plentiful, they are limited by power availability. The power needed for AI use-cases is exponentially higher than most current workloads. For example, a simple ChatGPT query consumes 10 times the amount of power of a Google search, an AI-generated image consumes 50 times as much power, and an AI video consumes 10,000 times as much power!
–
–
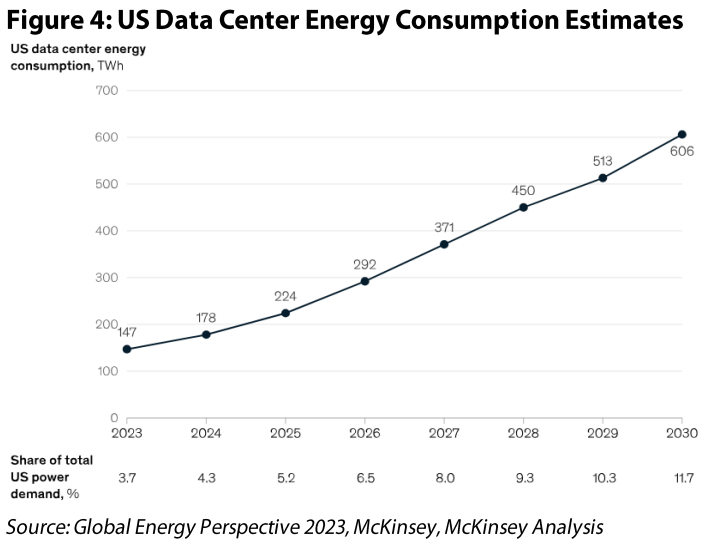
As shown in Figure 4, power needs for data centers in the US are set to quadruple from 2023 to 2030. According to the International Energy Agency, this would require an investment of at least $240 billion, in addition to significant permits and dealings with government agencies. To combat this, the White House issued an executive order titled ‘Accelerating Federal Permitting of Data Center Infrastructure’ to ease some of the red tape involved with energy projects. To the extent that the industry is not able to provide enough supply, we would expect rents to climb further in response.
–
Conclusion
If our 15-year history of investing in data center REITs has taught us anything, it’s that it is a sector that is sensitive to hype and adoption cycles for use cases. The change in perception on cloud computing from being a negative to a positive is likely the best example, but it is likely that AI will be even more susceptible to ‘unknown unknowns’; we believe that some of the most powerful use cases have not even been conceived yet, which could further increase demand beyond some of the rosiest forecasts. Of course, this must be balanced with hype and valuation, but the management teams of DLR and EQIX are proven industry leaders, which will keep the companies at the forefront of where ‘the puck is going’.
–
As of July 31, 2025, data centers were trading at a weighted average AFFO multiple of 23x versus 21x for the broader REIT universe. As a result, our enthusiasm is somewhat tempered by valuation, resulting in a slight overweight position of 13% compared to the RMZ at 12%. The demand growth and subsequent flowthrough to earnings will not be in a straight line, as we have seen in 2025, and thus we believe there will be opportunities for active managers such as ourselves to make changes to allocations as ‘new news’ continues to alter the thesis. However, one thing is for sure: this remains a secular growth story that we do not intend to miss!
–
Matthew R. Werner, CFA
mwerner@chiltoncapital.com
(713) 243- 3234
Bruce G. Garrison, CFA
bgarrison@chiltoncapital.com
(713) 243-3233
Thomas P. Murphy, CFA
tmurphy@chiltoncapital.com
(713) 243-3211
Isaac A. Shrand, CFA
ishrand@chiltoncapital.com
(713) 243-3219
–
RMS: 2,940 (7.31.2025) vs. 2,966 (12.31.2024) vs. 3,177 (12.31.2021) vs. 1,433 (3.23.2020)
–
An investment cannot be made directly in an index. The funds consist of securities which vary significantly from those in the benchmark indexes listed above and performance calculation methods may not be entirely comparable. Accordingly, comparing results shown to those of such indexes may be of limited use.)
The information contained herein should be considered to be current only as of the date indicated, and we do not undertake any obligation to update the information contained herein in light of later circumstances or events. This publication may contain forward looking statements and projections that are based on the current beliefs and assumptions of Chilton Capital Management and on information currently available that we believe to be reasonable, however, such statements necessarily involve risks, uncertainties and assumptions, and prospective investors may not put undue reliance on any of these statements. This communication is provided for informational purposes only and does not constitute an offer or a solicitation to buy, hold, or sell an interest in any Chilton investment or any other security. Past performance does not guarantee future results.
Information contained herein is derived from and based upon data licensed from one or more unaffiliated third parties, such as Bloomberg L.P. The data contained herein is not guaranteed as to its accuracy or completeness and no warranties are made with respect to results obtained from its use. While every effort is made to provide reports free from errors, they are derived from data received from one or more third parties and, as a result, complete accuracy cannot be guaranteed.
Index and ETF performances [MSCI and VNQ and FNER and LBUSTRUU] are presented as a benchmark for reference only and does not imply any portfolio will achieve similar returns, volatility or any characteristics similar to any actual portfolio. The composition of a benchmark index may not reflect the manner in which any is constructed in relation to expected or achieved returns, investment holdings, sectors, correlations, concentrations or tracking error targets, all of which are subject to change over time.


