
REITs Can Hold the Line in a Tariff War | May 2025
For any readers fortunate enough to avoid the constant and conflicting barrage of headlines in April, uncertainty is up and stocks are down. The prospect of a trade war is impacting business and consumer confidence, and, more importantly, general uncertainty is further fanning the flames. In our view, this environment has elevated volatility, which creates opportunities for investors with a longer-term view.
–
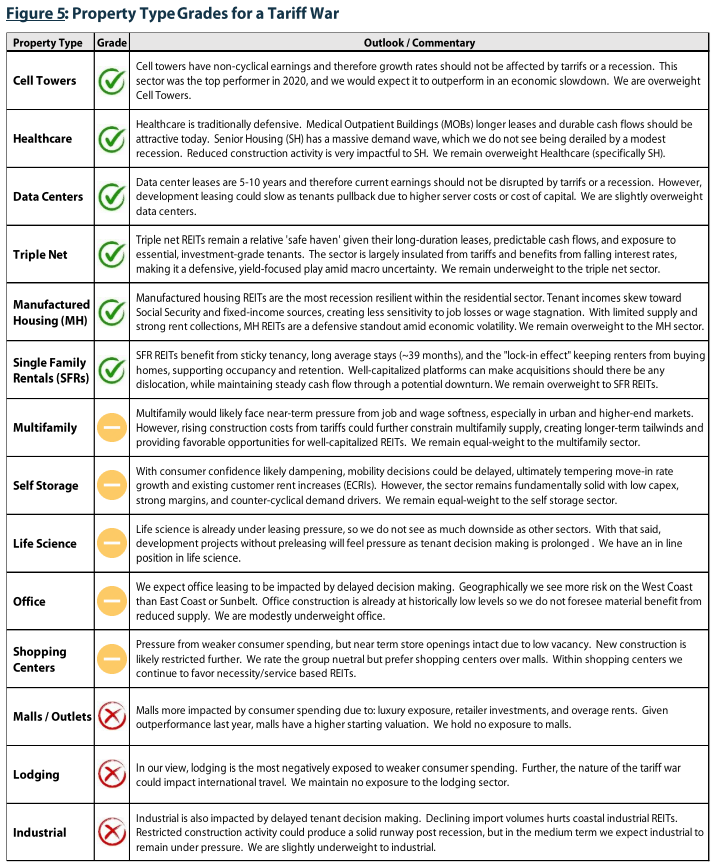
REIT cash flows are generally spared from direct tariff impacts because they do not import products to sell domestically. The indirect impacts are tougher to quantify, but they related to changes in consumer spending and business sentiment, which could have an effect on the tenants of REITs (see Figure 5 for a breakdown by property type). While the impact may vary by property, overall, we believe investing in an active REIT strategy in this environment is attractive for several reasons:
–
- REITs are defensive given the contractual nature of cash flows.
- REITs are historically undervalued relative to the broader equity market.
- In the event of a recession, incremental rate cuts would likely benefit REITs.
- Tariffs push up the cost of building materials which increases the value of existing real estate and higher replacement costs translate into future rental growth
- Higher construction costs will reduce new supply
- Sector divergence gives active managers more opportunities for alpha generation
–
What Has Happened So Far?
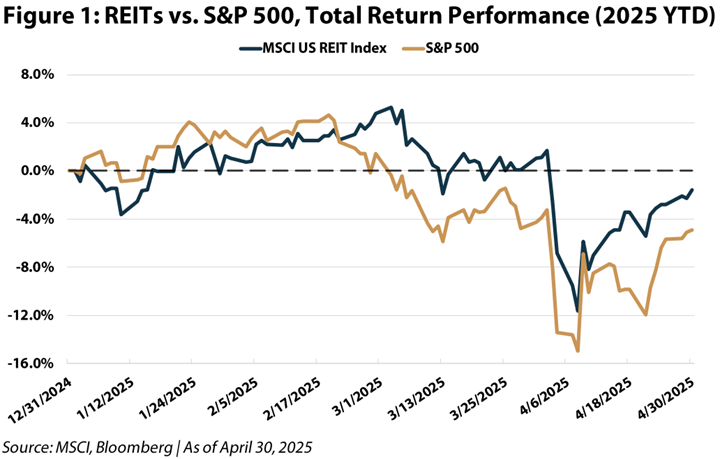
Following President Trump’s “Liberation Day” tariff proclamation on April 2, capital markets initially declined sharply. The S&P 500 fell over 10% over the first two days, while REITs posted a smaller drawdown of ~8%, outperforming by roughly 200 basis points as investors rotated into sectors offering more stable cash flows and inflation protection.
–
The landscape shifted again on April 9 when President Trump announced a 90-day pause on tariffs for over 75 countries while simultaneously raising tariffs on Chinese imports to 125%. Markets staged a historic relief rally, with the S&P 500 surging 9.5% that day – the third largest single-day gain since World War II. REITs, as measured by the MSCI US REIT Index (Bloomberg: RMZ) rose 6.5% on the same day.
–
Year-to-date through April 30, 2025, REITs have outperformed the S&P 500 by ~350 bps, reversing a multi-year trend of underperformance (Figure 1).
–
–
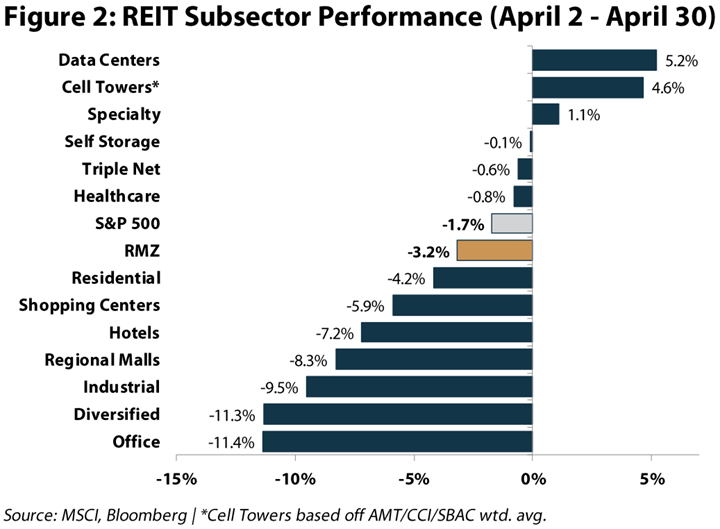
Within the REIT universe, sector-level performance has diverged meaningfully. Since April 2, economically sensitive sectors such as Office, Industrial, and Malls bore the brunt of the initial selloff, while less cyclical sectors including Cell Towers, Triple Net, and Healthcare held up relatively well, as shown in Figure 2.
–
–
In the bond market, the U.S. 10-Year Treasury yield fell nearly 25 basis points to ~4.0% immediately after the tariff announcement, reflecting heightened recession fears and expectations for a looser Fed in the back half of the year. However, yields sharply reversed following the April 9 tariff pause, spiking to ~4.5% on April 11 as investors priced in the inflationary risks of higher China-specific tariffs and stronger than expected CPI data. Since then, yields have drifted lower, ending April at ~4.2%, highlighting the ongoing tug-of-war between inflation concerns and broader macro slowdown fears.
–
Potential Pathways
Mapping potential pathways today is a challenging endeavor. The road forward likely remains choppy as the administration weighs a myriad of considerations and negotiates with various countries. In our view, until there is a resolution with some of the largest trading partners, economic activity levels are at risk of slowing including a significant reduction in global trade in the short to medium term. In addition to the impacts to global commerce, we believe consumer and business confidence has taken a hit that will take time to recover. However, we would note that a recession would also increase the likelihood (and magnitude) of interest rate cuts, which, all else equal, should lower long term interest rates and support REIT prices.
–
What could this mean for REITs specifically? First, the hit to business confidence is already delaying decision-making for prospective tenants. Moreover, lower consumer spending could A) further prolong decision-making and B) weigh on REITs with more direct exposure (lodging and malls). However, for existing landlords, higher tariffs could increase construction costs, which, along with lower business confidence, should lead to a further decline in new development and enhance the outlook for higher occupancy and rent, even if demand contracts slightly.
–
REIT Valuation
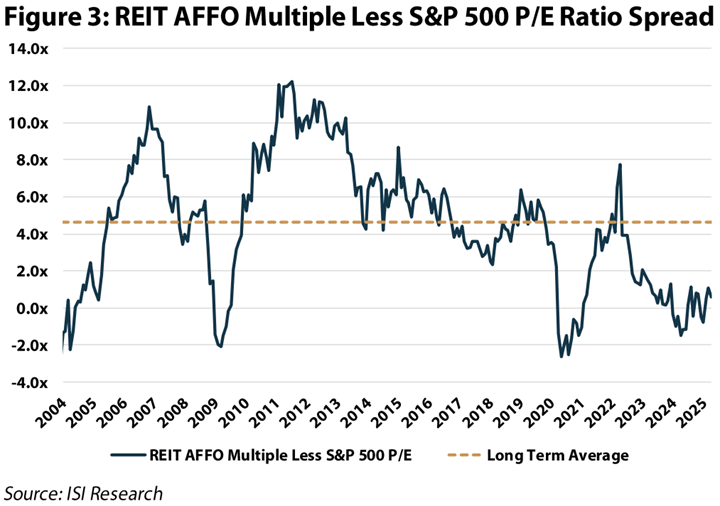
As we have discussed in numerous outlooks (see our 2025 REIT Forecast), the S&P 500 has had an exceptional run recently, and, as a result, REIT and broader market valuations stood near their widest levels at the start of 2025. Over the past 20 years, the REIT price to AFFO multiple (P/AFFO) has averaged a 4.6x premium over the S&P500 price to earnings (P/E), however, as of April 30th, 2025 the two measures are nearly in line (Figure 3).
–
–
Aside from relative valuation, we can compare REITs to private valuations based on their discount to net asset value (NAV). NAV is the market value of a REITs’ assets less liabilities. When REITs are trading below NAV, the public market is assuming a discount relative to the private market, and vice versa. As of April 30th, REITs are trading at a 13% discount to their NAVs based on a straight average. Historically, it has represented a compelling buying opportunity when REITs have reached this level of discount.
–
Dot Com Replay?
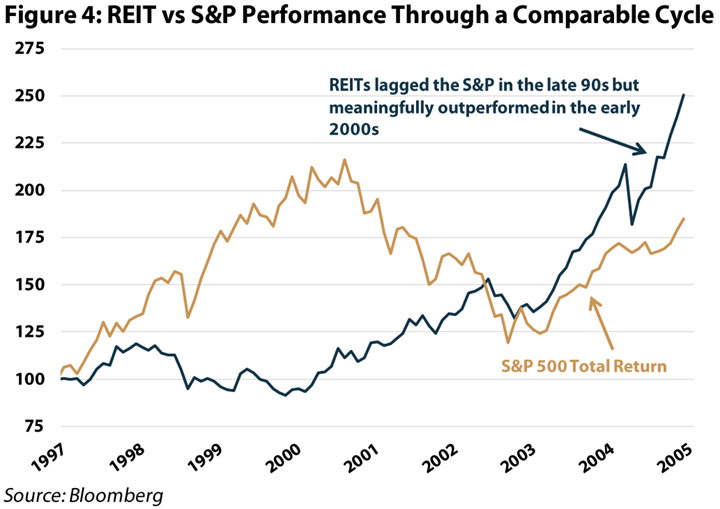
Today, Equity REITs pricing versus the broad market somewhat parallels the experience between 1999 and 2000. In 1999, the “Dot-Com” craze was forming a top with the NASDAQ gaining 86% in the year versus REITs falling 12% (excluding dividends). The punchline arrived in 2000, when the NASDAQ fell almost 40% while REITs bucked the trend and actually climbed 26% for the year. For a broad view, Figure 4 compares REIT and S&P 500 performance from 12/31/1996 to 12/31/2004. Importantly, even including the tech-driven run up in the late 1990’s, the RMZ meaningfully outperformed the S&P 500 over the full period (12% annualized total return versus the S&P 500 at 8%).
–
Fast forward to 2025, and, after years of underperformance, REITs are trading at a meaningful discount to the broad market based upon the historical relationship with S&P 500 P/E ratio. Furthermore, we believe that REITs have been de-risked versus the long-term periods when they traded at higher multiples than the S&P 500, and especially de-risked versus where they were in 1999. The REIT index today reflects substantially more property sectors with more durable cash flow streams (i.e., data centers and cell towers), have materially stronger balance sheets (4.9x Debt/EBITDA as of April 30th, 2025) and, therefore are worthy of better pricing metrics than historical averages, in our opinion. Additionally, low dividend payout ratios of (72% as of April 30th, 2025) are supportive of 4-5% dividend growth rate for the foreseeable future based upon our analysis.
–
–
How We Are Taking Advantage of Volatility
Initially, our assessment that near term REIT earnings would be relatively unscathed by a trade war gave us confidence to invest cash as the market pulled back in early April. The next step was assessing our exposure to each property type. We concluded that our portfolio was well-positioned for a trade war, given our underweights to lodging, regional malls, and industrial, and our overweights to cell towers, data centers, single family rentals, and healthcare.
–
The final step was, and will continue to be, finding market anomalies where the price action differed from what we believe should happen given the ‘new news’. Beyond that, we can also assess downside/upside scenarios to make investments into companies that may already be reflecting an overly draconian scenario.
–
As shown in Figure 5, we have put each property type into one of three buckets: positive, neutral, negative. When comparing Figure 5 with Figure 2, one can determine that the market reaction was mostly in-line with what we thought it would be. The only outlier was office, which was the third worst performer, yet we believed the tariffs would have a neutral effect. We used April’s price action as an opportunity to increase several office names (HIW and BXP) back to model weight for clients.
–
–
Another interesting market movement was in data centers, one of the worst performing sectors YTD in spite of the recent outperformance. We believe that the noise about potential changes in AI spending due to ChatGPT competitors will not have an effect on near term earnings for data center REITs. In particular, Digital Realty Trust (NYSE: DLR) had significantly underperformed Equinix (NYSE: EQIX) on the Deep Seek announcement in January. We took advantage of the pullback in DLR to take the position from equalweight to overweight.
–
Finally, we added some risk to the portfolio by increasing positions in COLD and REXR to model weight, both with potential direct impacts from a trade war. COLD reached an all-time low in April, while REXR was trading at a level it had not seen since early 2019.
–
Conclusion
In today’s environment dominated by volatility and uncertainty, REITs have once again demonstrated their defensive qualities. Furthermore, while our defensively tilted portfolio held up very well amidst April’s turbulence, we also believe volatility has created opportunities for active management. As such we have been aggressively stress testing our models for a trade war scenario and, where appropriate, have been upgrading to quality names caught up in the pullback. The indirect effects of trade tensions on real estate fundamentals remain nuanced, but, overall, REITs benefit from contractual income streams from credit tenants, robust balance sheets with flexible access to capital, and an increasingly favorable supply-demand backdrop. Additionally, REIT valuations remain historically attractive both on a relative and absolute basis, and we remain confident in our initial total return forecast of 10-15% for 2025.
–
Matthew R. Werner, CFA
mwerner@chiltoncapital.com
(713) 243- 3234
Bruce G. Garrison, CFA
bgarrison@chiltoncapital.com
(713) 243-3233
Isaac A. Shrand, CFA
ishrand@chiltoncapital.com
(713) 243-3219
Thomas P. Murphy, CFA
tmurphy@chiltoncapital.com
(713) 243-3211
–
RMS: 2,920 (4.30.2025) vs. 2,966 (12.31.2024) vs. 3,177 (12.31.2021) vs. 1,433 (3.23.2020)
–
An investment cannot be made directly in an index. The funds consist of securities which vary significantly from those in the benchmark indexes listed above and performance calculation methods may not be entirely comparable. Accordingly, comparing results shown to those of such indexes may be of limited use.)
The information contained herein should be considered to be current only as of the date indicated, and we do not undertake any obligation to update the information contained herein in light of later circumstances or events. This publication may contain forward looking statements and projections that are based on the current beliefs and assumptions of Chilton Capital Management and on information currently available that we believe to be reasonable, however, such statements necessarily involve risks, uncertainties and assumptions, and prospective investors may not put undue reliance on any of these statements. This communication is provided for informational purposes only and does not constitute an offer or a solicitation to buy, hold, or sell an interest in any Chilton investment or any other security. Past performance does not guarantee future results.
Information contained herein is derived from and based upon data licensed from one or more unaffiliated third parties, such as Bloomberg L.P. The data contained herein is not guaranteed as to its accuracy or completeness and no warranties are made with respect to results obtained from its use. While every effort is made to provide reports free from errors, they are derived from data received from one or more third parties and, as a result, complete accuracy cannot be guaranteed.
Index and ETF performances [MSCI and VNQ and FNER and LBUSTRUU] are presented as a benchmark for reference only and does not imply any portfolio will achieve similar returns, volatility or any characteristics similar to any actual portfolio. The composition of a benchmark index may not reflect the manner in which any is constructed in relation to expected or achieved returns, investment holdings, sectors, correlations, concentrations or tracking error targets, all of which are subject to change over time.


