Portfolio Insight | 1st Quarter 2024
The S&P 500 continued its nearly unabated move higher in the first quarter, vaulting upward by 10.6% to end the quarter at 5,254, a new all-time high. Inflation picked up marginally, as did earnings expectations. Investor confidence that the Federal Reserve can achieve its inflation target without causing a recession also helped drive the market.
In the first quarter, the strongest sectors were Communication Services, Energy, and Information Technology while Real Estate, Utilities, and Consumer Discretionary lagged the most. Every sector except Real Estate registered gains in the period, with five out of eleven outperforming the index. As in 2023, growth stocks continued to significantly outpace value stocks, driven largely by strong earnings momentum, and large caps continued to outpace small-to-midsize companies.
Relentless Uptrend Persists
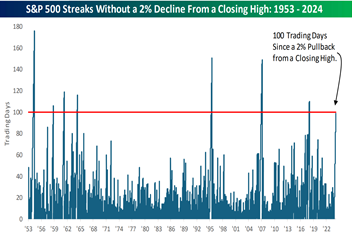
Amazingly, the S&P 500 has not experienced a pullback of 2% from a closing high in over 100 trading days, per Bespoke Investment Group. Such 100-day runs have only happened seven other times since 1952, most recently in 2018.

Source: Bespoke Investment Group
Though it might be counterintuitive, this phenomenon has actually been a bullish indicator for forward returns. The data shows that six months after such an occurrence, the S&P 500 was higher all seven times with a median gain of 8.2%, and one year later, the index was higher six out of seven times with a median gain of 9.4%.
Mixed Mag 7
Following a massive 107% run in 2023, the collective performance of the so-called “Magnificent 7” stocks has been more mixed so far in 2024, but the overall market has continued to rise anyway. Of these seven stocks, only four, NVIDIA, Meta Platforms, Amazon, and Microsoft are outperforming the overall S&P 500. Alphabet, Apple, and Tesla are lagging, with the latter two deeply negative on the year.

Source: Bloomberg
Because they are a large (28%) component of the market-cap weighted S&P 500 index, this group of companies has contributed positively to 2024 market gains. However, if they were excluded, the market would still be up over 7% for the year, per Bloomberg. As investors become more confident about the likely eventual declining path of interest rates in 2024, market leadership could broaden out and sustain the rally, making the Mag 7 less important for future gains.
Positive Earnings Revisions
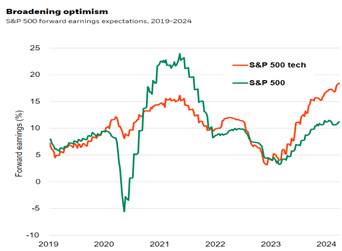
Earnings drive the market over time, and recent news on that front has been so positive that the S&P 500 has already surpassed many strategist targets for the end of 2024. The current market run that began in earnest last fall has been fueled by persistent upgrades of expected forward earnings growth both for the overall S&P 500 and the technology sector, as seen in the chart below.

Source: Blackrock Investment Institute
Falling inflation growth, the anticipation of future rate cuts, a resilient consumer, and a major secular growth and productivity driver in artificial intelligence (AI) have boosted expected gains for a broad range of sectors, not just information technology. However, future earnings expectations have risen much faster in tech. The divergence between tech and other sectors has actually widened in the last six months or so, leading to its superior gains.
Domestic Equity Outlook
As mentioned at the beginning of 2024, if current economic trends persist and drive further earnings growth, the market may continue to move higher. In the short run, it would be prudent to expect an increase in volatility and a potential pullback, considering the historic unbroken run that stocks have had recently. Absent some unforeseen geopolitical disruption, the most obvious known risk to additional gains would be a continuation of the recent uptick in inflation that delays the Fed’s expected interest rate cuts. However, while shorter-term inflation metrics have come in higher than expected, the longer-term disinflationary trend remains intact.
Many large cap technology companies, especially those with ties to AI, continue to make a case for further gains because of outstanding earnings results, positive earnings revisions, and bright outlooks. However, fresher individual stories with potentially higher upside can be found in other corners of the market despite the robust recent index gains. Active managers with a consistent, proven, disciplined investment process should continue to have an advantage over passive vehicles as they can choose to own the most attractive names and exclude the rest.
Fixed Income Outlook
Unlike the S&P 500, the bond market has started 2024 on a bit of a down note. The Bloomberg US Aggregate Bond Index, a combination of government and corporate bonds, fell 1.1% during the first quarter. Higher interest rates were the primary headwind for fixed income investors during the quarter, with 10-year Treasury yields rising from 3.88% to 4.20%, and shorter-term Treasury yields up a similar amount. Fortunately, most bonds in client portfolios are in positive territory year-to-date due to a shorter maturity profile (longer-term bonds are more interest rate sensitive).
Perhaps the most significant factor fueling the recent rise in interest rates has been a reduction in the number of expected Federal Reserve interest rate cuts. Since pivoting from rate hikes, the Fed has consistently tried to nudge market rate cut expectations lower due to stronger-than-expected economic growth and stickier-than-hoped-for inflation. The bond market is now pricing in just three 0.25% rate cuts through the end of 2024, down from the five or six expected just a few months ago.
While stronger economic growth and slowing inflation come as a welcome sign, the Fed has yet to achieve its targeted inflation rate of approximately 2%. In February, the Fed’s preferred inflation metric (Core Personal Consumption Expenditures, or Core PCE), which excludes the volatile food and energy categories, posted a YOY growth rate of 2.8%. While that constitutes a decline from much higher levels (this metric peaked at 5.6% in early 2022), the 2.8% level is still not close enough to 2% for the Fed to feel comfortable cutting rates.
Like the US Federal Reserve, most advanced-economy central banks are poised to begin cutting rates in the near future. In fact, the Swiss National Bank recently became the first major economy to cut rates this cycle. The one outlier, the Bank of Japan, actually raised rates for the first time in nearly two decades, ending eight years of negative interest rates. Here in the US, the market currently expects the Fed’s first rate cut to take place in June.
We are still of the opinion that bond yields remain attractive for clients with fixed income allocations. Most of the corporate bonds we are buying today, with maturities of 1-5 years, yield between 4.5% – 5.0%. While we still believe that bond yields may move somewhat lower over the longer term, our use of a laddered bond strategy helps to mitigate interest rate risk. In the event we are incorrect in our lower rate assumption, maturing bonds could be reinvested at higher yields to maturity. As always, each bond is bought with the intent to hold until maturity.
Global Markets Outlook
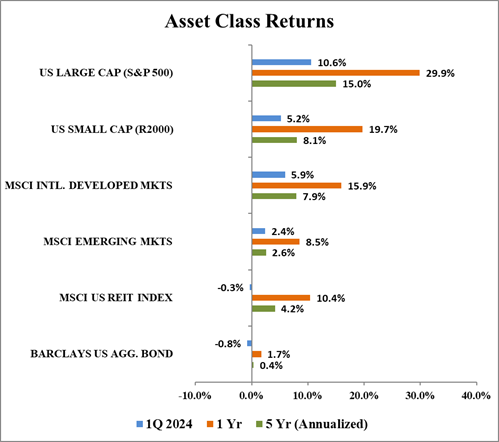
Global markets climbed higher during the first quarter, but with a wide divergence between US large caps stocks and the rest of the market. US large cap stocks surged 10.6% to start the year, while international developed markets gained 5.9%, US small caps rose 5.2%, and emerging markets increased 2.4%. The trend of US large cap outperformance has continued thanks to their outsized weighting towards growth-oriented sectors such as Information Technology and Communication Services. These sectors were two of the top three best performing sectors in the S&P 500 so far this year and are the best performing sectors over the last year.

Source: Bloomberg, Chilton Capital Management
The outperformance of these sectors is well deserved. According to recent data from FactSet, Information Technology is predicted to have the fastest earnings growth in 2024 at 18.2%, and Communication Services is projected to be second fastest at 17.4%. Importantly, both of these sectors have experienced materially positive earnings revisions since the start of the year, whereas most other sectors have had negative revisions.
Aside from earnings growth, the other factor that will determine what the future holds for these sectors is valuation. Again, using data from FactSet, Information Technology looks expensive with a forward P/E of 28.5x compared to its 5-year historical average of 23.8x. Communication Services trades close to historical levels at 19.1x versus its 5-year average of 18.7x. This leads to a mixed conclusion. Information Technology is trading at a premium of almost 20%, which is expensive but
well below the record high of 48.3x, or more than a 100% premium, in March 2000. Meanwhile, the Communication Services segment is right around its average. Since valuations are not extreme, it is possible that both of these sectors continue to materially outperform in the near term, leading to sustained US large cap outperformance. However, their higher starting valuations make the longer-term picture less clear. If earnings estimates are not revised even higher for these growthy sectors, US large caps may cede performance to more value weighted international markets.
REIT Commentary
In the first quarter, the MSCI US REIT Index (RMZ), produced a total return of -0.3%. After a blazing finish to 2023 due to a ~100 basis point decline in the 10-year Treasury yield, the trends reversed as the 10-year Treasury yield increased 32 basis points to finish the quarter at 4.20%. Unfortunately, we expect the volatility around the timing and quantity of interest rate cuts by the Federal Reserve to continue to drive REIT pricing over the near term. However, we do believe that REITs will be able to garner investor flows as the Fed is able to communicate a clear path for future rate cuts.
4Q REIT earnings season showed that business was better than most expected, though guidance was decidedly conservative given the uncertainty around interest rates and the economy. Many earnings calls noted the strength of REIT balance sheets and availability of capital to deploy when accretive opportunities arise.
Due to their infinite lives, public REITs have to be astute allocators of capital and properly respond to changes in the cost and availability of capital. Given the lack of accretive acquisition opportunities today, one of the best uses of free cash flow is reinvesting in the portfolio. Called “capex,” or “maintenance capital expenditures,” public REITs have used times such as these in the past to gain occupancy market share over their competitors by properly maintaining and even upgrading their portfolios when their competitors may be forced to neglect their properties.
Since real estate held in private hands tends to be heavily leveraged (typically with floating rate debt), private owners often have to cope with reduced cash flows in periods of rising interest rates due to higher interest expense. In such cases, they may be forced to sacrifice “best practices” used in property management. However, the superb access to capital and low leverage (mostly with fixed rate debt) of public REITs gives them a significant advantage during such times to attract tenants who are looking for a landlord that isn’t strapped for cash. Furthermore, public REITs can also use this capital advantage to buy out owners that are suffering negative cash flow or are under pressure from lenders.
There are multiple examples of this across most property types. The average multifamily REIT boasts occupancy of 95.7% as of December 31st, 2023, which compared to nationwide apartment occupancy of 94.1% as of the same date. Simon Property Group (SPG), a mall/outlet REIT, leased over 18 million square feet in 2023, bringing its occupancy to 95.8% at the end of 2023. The compares to nationwide mall occupancy of 85.6%, a number that would be significantly lower if REIT-owned malls were excluded. Similarly, Boston Properties (BXP), a Coastal office REIT, leased 4.5 million square feet in 2023, bringing its year end occupancy to 88.4%. In contrast, the national occupancy for office properties as of the same date was only 80.4%. Even more significant, BXP’s San Francisco properties were 84.4% leased as of year-end, which compared to the city’s average occupancy of 64.4%.
In late 2024 and 2025, we believe public REITs will have a real opportunity to take advantage of distress. Instead of cutting interest rates to zero, the current expectation calls for only six 25 basis point cuts, leading to a Fed Funds Rate of 4% by year end 2025. Assuming the interest rate curve is not inverted, a normal borrowing spread of 150-250 basis points would lead to borrowing costs of at least 5.5%, likely not enough to help heavy borrowers with near term maturities. In addition, the government does not seem motivated to backstop bank commercial real estate loans as they were in 2009. As such, though counterintuitive, public REITs are hoping for carnage.
Bradley J. Eixmann, CFA
Brandon J. Frank
Robert J. Greenberg, CFA
Matthew R. Werner, CFA