Public REITs: Are We There Yet? | November 2023
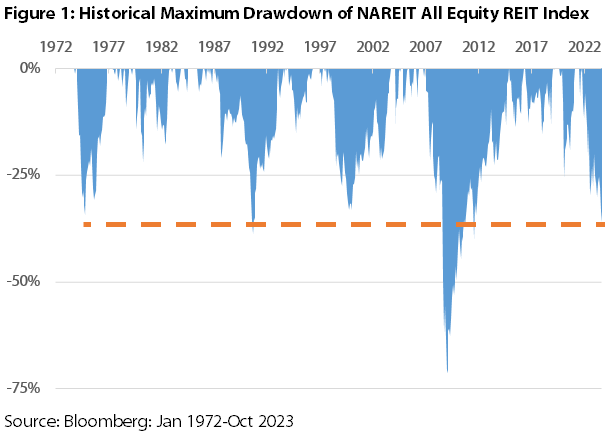
Public REIT pricing has declined in a steep fashion over the past 22 months. Although this is not the first time they have had a significant pullback, it is quite rare, as shown in Figure 1. As recently as March 2020, the drawdown in the FTSE NAREIT All Equity REITs Index (Bloomberg: FNER)* was nearly 42%, and the drawdown in 2007-2009 was over 73%! We can look at historical cycles to find the similarities to today to figure out how far REITs need to fall to reflect the economic environment. Investors that were able to look through the negative headlines at these points were rewarded handsomely, and we may be near one of those points as of October 31, 2023.
–

–
In addition to the magnitude, the length of the decline in pricing over the past 22 months is quite rare. If FNER finishes in negative territory this year, it will be only the fourth time since 1972 that the REIT index has been negative for two consecutive years. The average total return in the year following the second consecutive negative year was +25%, and the average two year cumulative total return was +61%. Notably, the index has never been negative for three consecutive years.
–
While each cycle is different, they do often rhyme. In examining the past, we believe that the REITs are in a completely different place than they were before each of these similar periods, but the market hasn’t realized it yet. As such, we believe that the REIT prices have already overcorrected, but private real estate has only just begun to feel the pain. Going forward, we maintain our conviction in the durable and (mostly) growing cash flows that will lead to higher dividends, and, hopefully, prove to the market that their heavy lifting for the past 14 years has prepared them for this exact scenario.
–
Brief REIT History
In the early 1990’s, the traditional sources for real estate lending such as commercial banks were no longer willing or able to provide financing. Many excellent private real estate companies were forced to go public to refinance the capital structure with a significant equity infusion. However, they needed something to ‘hook’ the new public market investors: YIELD. As such, dividend payout ratios were as high as possible with the hope that a premium price would enable accretive equity offerings to build the company and fund a growing dividend.
–
This strategy can work when capital markets are functioning and cash flow is stable or growing, but it does not work through a full cycle that ends with a recession. Most relevant and recent, the Global Financial Crisis (GFC, 2008-2009) was partially caused by too much leverage in real estate. Bankruptcy risk was real, as the shutdown in capital markets created a mismatch in cash uses and sources. The only way to appease bondholders and banks was to raise dilutive equity in the public market. Some REITs even resorted to paying dividends by issuing new shares instead of cash in order to maintain their REIT status and retain cash.
–
Surprisingly, the earnings from properties actually did not decline much at all. According to Green Street Advisors, same store net operating income (ex-lodging) actually increased over 2% in 2008, and decreased only 1% in 2009. Therefore, it was the amount of leverage, type of leverage, and high payout ratios that caused dividends to be cut, and ultimately forced many companies to ‘lock-in’ the property value declines.
–

–
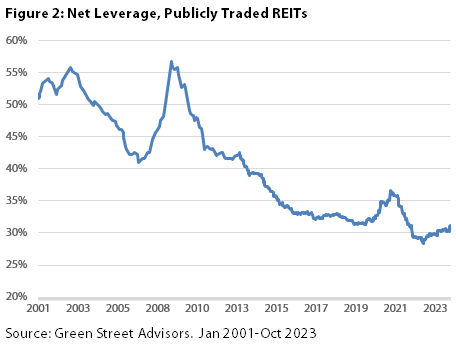
Although steep, the peak-to-trough decline of 73% in 2008-2009 was ‘about right’ given an estimated decline in the unlevered Green Street Advisors Commercial Property Price Index (or CPPI) of 32.3%. CPPI measures the estimated gross market value of REIT properties based on transactions being negotiated and contracted. As shown in Figure 2, the net leverage of public REITs going into 2008 was about 50%. This ratio would produce a 64.6% decline in the net asset value (or NAV) based on the 32.3% gross property value decline (32.3% / (1-50%) = 64.6%). NAV is the estimated net market value of REIT assets based on transactions.
–
Though public REIT equity prices are marked to market on a daily basis on the NYSE and NASDAQ, NAV is a much more steady number, less subject to market sentiment and capital flows. In general, NAV will change based on the performance of properties and changes in property values. However, NAV per share can change due to equity issuance or buybacks, a true test of management capital allocation prowess.
–
After the trough in July 2009, CPPI recovered to the prior peak by March 2013, equating to a 45 month time period. In theory, the NAV of the industry should’ve had a similar period of recovery. In reality, FNER did not eclipse its 2007 peak until January 2015, 23 months later. This was the direct result of dilutive equity raises in 2009, which permanently impaired NAV per share such that it took the CPPI rising to 17% above the prior peak until FNER reached a new high.
–
How Could This Have Been Prevented?
Obviously, less leverage would’ve been better. Taking down leverage by half (from 50% to 25%) would’ve only decreased the NAV by 43.1% (32.3% / (1-25%) = 43.1%) instead of 64.6%.
–
In addition, the laddering of debt maturities such that there was little debt maturing in the period when the capital markets were closed or extremely expensive (unfavorable spreads). In 2008, the weighted average maturity of REIT debt was ~5 years, which implies that 40% of REIT debt was due in 2008 and 2009. A smaller amount (or ideally none) would’ve prevented the need to raise equity to satisfy debt covenants.
–
Finally, dividend payout ratios (dividend / adjusted funds from operations**) were 83% in 2008, implying there was only 17% of cash available after paying dividends and servicing their properties for maintenance capital expenditures. Ultimately, two-thirds of REITs cut their dividends to preserve as much cash as possible, much to the disappointment of investors. A lower payout ratio would’ve prevented the need for a dividend cut, and would’ve given REITs the flexibility to use their free cash for debt pay down or even accretive acquisitions of distressed properties.
–
14 Years Later…Lessons Learned
Following the GFC, management teams and board members of all REITs decided that they would not want to go through the stress of that all over again. In fact, equity investors demanded it, ascribing a premium to companies with better leverage and payout ratio metrics. The zero interest rate policy (or ZIRP) over the following 12 years gave them the perfect opportunity to take care of the issues that had previously gotten them into trouble.
–
As a result, public REITs entered 2022 with leverage of approximately 26%, a weighted average debt maturity of 7.2 years, and a payout ratio of 68%. Sure, REITs could’ve maintained higher leverage from 2010-2021 when interest rates were near zero, likely boosting earnings growth and dividends. However painful, they instead decided to de-risk their respective companies to ensure they could endure anything the capital markets could throw at them. As a result, public REITs had a higher cost of capital than their private peers, who gobbled up as much debt as the banks or credit funds would provide. In turn, public REITs traded at an average 4% discount to NAV (private valuations) from 2012-2021 as private funds raised billions of dollars, borrowed even more, and raked in record fees.
–
As inflation began to run rampant in early 2022, the Fed embarked on the most aggressive rate hike cycle in history – one that we are still in today. One of the main targets of the fight against inflation is rent, putting real estate once again directly in the crosshairs of the Fed, although this time instead of the Fed cutting rates and even pursuing fiscal policy to save banks and real estate, the Fed is pushing the gas until the proper amount of pain is inflicted. Aside from a few banks in early 2023, there has yet to be the full freight of victims that the Fed would like to see, in our opinion.
–
However, with REIT prices, as measured by FNER, down 31.4% from December 31, 2021 to October 31, 2023, public REITs (and public REIT investors) are feeling the pain. For the aforementioned reasons outlined above, we believe that the public market is improperly using the playbook from 2008-2009 in its revaluation of public REITs.
–
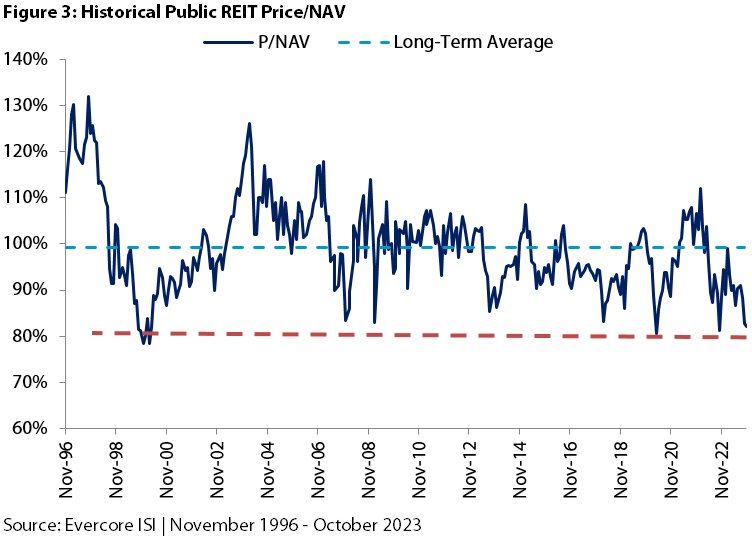
As of September 30, 2023, the CPPI is down 16.5% from its 2022 high. Using leverage of 26% (per Green Street Advisors) as of March 2022, the implied NAV decline would be 22.2% (16.5% / (1-26%) = 22.2%). Obviously, public REITs have underperformed the NAV decline, and, as a result, are trading at a 18% discount to NAV as of October 31, 2023, in-line with historical records reached only two times before. This discount could reflect either dividend, leverage, or capital markets risk, or it could reflect anticipation of further declines in CPPI going forward.
–
We believe dividend, leverage, and capital markets risk is near zero, given the heavy lifting that the public REITs have done in the past 14 years. Public REITs have only 6.6% of debt maturing in 2024. And, with leverage of only 32% as of September 30, 2023, this equates to only 2.1% of total market capitalization (market capitalization plus debt). Instead of dividend cuts, dividends are estimated to grow by 12% in 2023, and we anticipate another year of growth in 2024 in the mid-single digit range. Finally, with dividend payout ratios at 71% as of September 30, 2023, the free cash flow of 29% provides internally generated ‘equity’ that negates the need to raise any dilutive equity.
–
Could CPPI decline further? Of course. With the current discount to NAV, CPPI could decline another 11% and REITs would still be trading in-line with NAV. In fact, we believe that most REIT CEOs are actually rooting for CPPI to decline further for several reasons. First, it would finally start to inflict the pain that the Fed is looking to achieve, bringing inflation back in-line with its stated goal of 2%, and thus allowing for the rate hike cycle to end. Second, the distress would create significant acquisition opportunities. If this were the case, public REITs would have a much better cost of capital than private peers given lower debt. In this case, public market investors should be ascribing a premium to NAV for the public REITs, giving them the green light to grow NAV, earnings, and dividend – something that is NOT being factored into REIT prices as of October 31, 2023. As shown in Figure 3, the NAV premium has been as high as 32% in the past, something that should be achievable again when the cost and availability of capital discrepancy between public and private is this high. Notably, REITs traded at an average 2% premium for the three calendar years following the GFC.
–

–
Are We There Yet?
We believe public REITs have already fallen farther than they should have given the lack of dividend, leverage, and capital markets risk. Same store net operating income growth is projected to be 5.5% in 2023, 4.6% in 2024, and 4.4% in 2025. Due to the incredibly sound balance sheets of public REITs, this flows to the bottom line to produce estimated AFFO growth of 4.7% in 2023, 5.6% in 2024, and 5.4% in 2025 (all before factoring in accretive acquisitions).
–
In contrast, we can observe private owners through anecdotes who presumably have similar same store NOI growth, but have seen AFFO decline to zero or even go negative. For example, BREIT (a non-traded REIT), has reported year to date same store NOI growth of 6% as of September 30, 2023, an impressive feat, and in-line with the public REITs in similar property types (single family rental, industrial, data centers, gaming, multifamily). However, while BREIT has had negative AFFO every year since launching, 2023 looks to be the most negative due to its $83 billion debt load. As of June 30th, the non-traded REIT had $15.5 billion in interest rate caps maturing with an average term of 6 months, which, if not renewed, would cause floating rate debt to increase to 28% from 9%. With a weighted average interest rate on the maturing caps of 4.4% and, using current interest rates, the unhedged debt would now be priced at 7.8%, resulting in a $527 million increase in interest expense on an annualized basis. For reference, BREIT paid interest expense of $2.3 billion for the entire year in 2022.
–

–
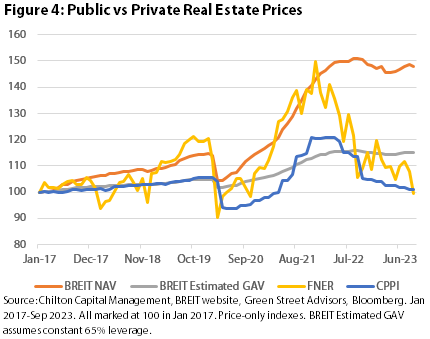
Ironically, BREIT’s NAV as of September 30, 2023 is up 2% from its April 2023 low, while the FNER has declined by 10.1% from March 31, 2023 to October 31, 2023. As shown in Figure 4, the NAV of BREIT has been steadily growing since inception in January 2017. Its peak-to-trough decline from a high in September 2022 to April 2023 was -3.6%. We can use its estimated leverage of 65% to derive that the company believes that the gross asset values (or GAV) of its properties have declined by 1.3% (-3.6% * (1-65%) = -1.3%). Obviously, all parties can’t be correct.
–
As such, we believe the public and private markets have it wrong. Going forward, we believe public REIT prices should stay flat, or even increase, as private real estate prices decline, assuming a stable 10 year Treasury yield. While a further rise in the 10 year Treasury yield remains the biggest risk, we contend that public REITs will do much better than private real estate in this environment, and could produce surprisingly positive returns if investors gain the confidence to assign a premium to public REITs as they did in the past.
–
*We are using FNER instead of RMZ as its inception date goes back much further
**Adjusted Funds from Operations = AFFO = cash flow after maintenance capex
–
Matthew R. Werner, CFA
mwerner@chiltoncapital.com
(713) 243- 3234
Thomas P. Murphy, CFA
tmurphy@chiltoncapital.com
(713) 243-3211
Bruce G. Garrison, CFA
bgarrison@chiltoncapital.com
(713) 243-3233
Isaac A. Shrand, CFA
ishrand@chiltoncapital.com
(713) 243-3219
–
RMS: 2,248 (10.31.2023) vs. 2,398 (12.31.2022) vs. 3,177 (12.31.2021) vs 1,433 (3.23.2020) and 2,560 (2.21.2020)
–
An investment cannot be made directly in an index. The funds consist of securities which vary significantly from those in the benchmark indexes listed above and performance calculation methods may not be entirely comparable. Accordingly, comparing results shown to those of such indexes may be of limited use.)
The information contained herein should be considered to be current only as of the date indicated, and we do not undertake any obligation to update the information contained herein in light of later circumstances or events. This publication may contain forward looking statements and projections that are based on the current beliefs and assumptions of Chilton Capital Management and on information currently available that we believe to be reasonable, however, such statements necessarily involve risks, uncertainties and assumptions, and prospective investors may not put undue reliance on any of these statements. This communication is provided for informational purposes only and does not constitute an offer or a solicitation to buy, hold, or sell an interest in any Chilton investment or any other security. Past performance does not guarantee future results.
Information contained herein is derived from and based upon data licensed from one or more unaffiliated third parties, such as Bloomberg L.P. The data contained herein is not guaranteed as to its accuracy or completeness and no warranties are made with respect to results obtained from its use. While every effort is made to provide reports free from errors, they are derived from data received from one or more third parties and, as a result, complete accuracy cannot be guaranteed.
Index and ETF performances [MSCI and VNQ and FNER] are presented as a benchmark for reference only and does not imply any portfolio will achieve similar returns, volatility or any characteristics similar to any actual portfolio. The composition of a benchmark index may not reflect the manner in which any is constructed in relation to expected or achieved returns, investment holdings, sectors, correlations, concentrations or tracking error targets, all of which are subject to change over time.