Senior Housing REITs: The Cure for Rising Rates | October 2023
Although healthcare was thrown for a loop during the pandemic, Senior Housing (SH) is experiencing some of the strongest fundamentals we have seen in a long time. Rebounding occupancy, stronger rental rates, and moderating labor headwinds are generating double digit Net Operating Income (NOI) growth. Occupancy is still below prior peaks, but we believe demographic trends (80+ year old population growth rate) position the property type for exceptional demand growth. Typically, increasing demand is met with growing supply at an equal or greater pace. However, rising construction and financing costs have kept new development minimal. Combining rapid demand growth with minimal new supply, we believe SH fundamentals are entering an impressive multi-year runway of above-trend growth.
–
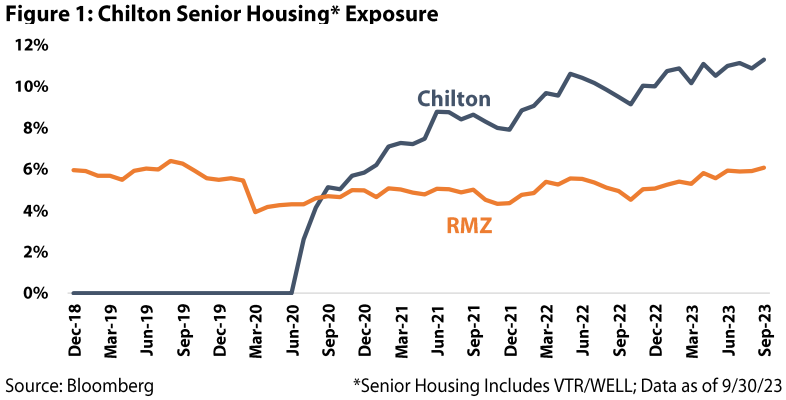
For this reason, we have increased our positions in both SH-focused REITs, Welltower (NYSE: WELL) and Ventas (NYSE: VTR). Highlighted in Figure 1, the Chilton Composite held a 11.2% position in the two names, which compares to the MSCI US REIT Index (Bloomberg: RMZ) at 6.3% as of 9/30/23.
–
Bifurcated Performance
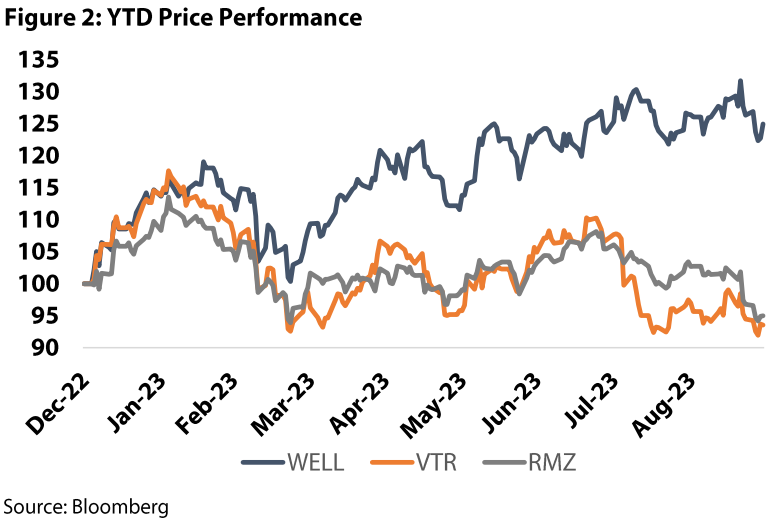
Although both REITs have posted impressive operating improvements, WELL’s recovery has shined brighter than VTR on a total return basis. Specifically, as of 9/30/23, WELL is one of the top performing REITs year to date (+27.9% total return), which compares to VTR’s -3.6% and the RMZ’s -1.9% total returns over the same period (Figure 2).
–
While VTR has lagged WELL on most operational measures, we believe the current discount is overdone. Overall, we believe both names present attractive avenues to capitalize on the SH story.
–
Common Misconceptions
To start, let’s review what SH is NOT. SH is markedly distinct from a nursing home (technically a Skilled Nursing Facility – or SNF). While both offer essential care for seniors, SH communities are private-pay, amenity rich environments geared for affluent seniors looking to “age in place.” Conversely, SNFs deal with higher acuity patients and are typically funded through a combination of Medicare and Medicaid (adding an increased element of ‘stroke-of-the-pen’ risk for landlords). Another option is at-home care, which tends to be more expensive and does not offer any social aspect.
–
Today’s report focuses on SH properties, which are further broken into Independent Living (IL) and Assisted Living (AL) facilities. IL facilities focus primarily on the social needs of residents, with minimal medical support required. AL communities support residents who need daily assistance at a higher acuity level than IL. AL is built around a rental model, where costs track the level of care required. Conversely, IL residents typically pay an entrance fee when they move in, followed by a monthly fee to cover maintenance, housekeeping, meals, and social programs. IL properties are much closer to small apartments (with social activities and meal plans) than nursing homes, and run the gamut up to ultra-luxury. As an example, Welltower recently developed a 19-story luxury community on the Upper West Side of Manhattan, where studio rents start around $15,000/month and one-bedrooms start around $21,500/month.

–
Ownership Structure
REITs own SH assets through one of two structures: traditional and RIDEA (or SHO). In the traditional structure, a triple net lease, REITs charge rent to the operator under a long term lease with annual escalators, but do not share in the upside or downside of the business. The operator is responsible for maintenance, taxes, insurance, and utilities.
–
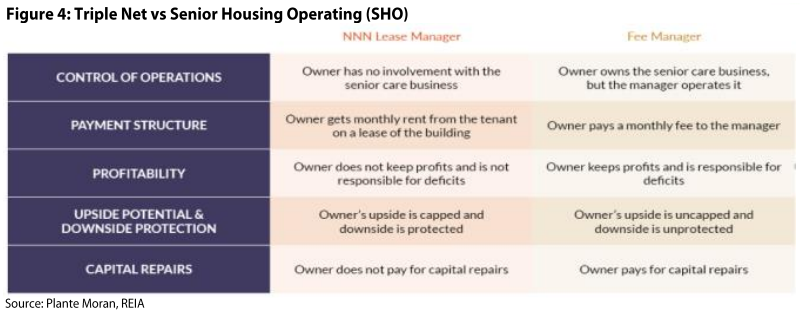
Starting in 2007, the REIT Investment Diversification and Empowerment Act (RIDEA) allowed healthcare REITs to participate in the operations of the business. This birthed the Senior Housing Operating (SHO) structure, where the REIT pays the manager a fee to operate the facility rather than charging rent. Figure 4 highlights the major differences, but most importantly, SHO allows the REIT to share in the operational upside at their properties. Over time, contract structures have evolved, but ideally, the owner and operator both share “skin in the game” and are aligned in a long-term strategy. Another important difference is that SHO contracts are shorter than triple net agreements, which affords the landlord more flexibility to cancel and transition operators.
–
Welltower has been at the forefront of this evolving structure since signing the first agreement with Merrill Gardens in 2010. While growing pains existed in the early agreements, WELL and VTR have tweaked contract structures to better align long-term incentives. As such, SHO is now the preferred structure for both companies. For example, WELL has increased its percentage of SHO NOI from 29% in 2013 to nearly 50% as of 6/30/23. This shift in the business model makes operator selection and relationship paramount.
–
Tech Playing Bigger Role
With the newfound ability to share in the operational upside, both REITs are investing heavily in technology to monitor, select, and assist operators. This focus was clearly on display with Welltower hiring John Burkhart as EVP and COO. Prior to joining, Mr. Burkhart spent 25 years at Essex Property Trust (NYSE: ESS), a best in class multifamily REIT where he developed revenue management platforms and implemented numerous technology optimization initiatives. It’s no surprise Welltower has been comparing today’s modernization opportunity in SH to multifamily in the 1970’s.
–
Management keeps the “secret sauce” close to the vest, but Mr. Burkhart identified some low hanging fruit. In one of his first reviews, he discovered that care revenue was being under-billed by over 25%. In another example, Mr. Burkhart’s team sent 200 customer inquiries to various operators. 50% of the calls were never returned and, on average, returned calls took 13 business hours. As a result, he replaced a “sticky note” system with a modernized tracking system that was already common with multifamily operators, which has quickly yielded impressive results.
–
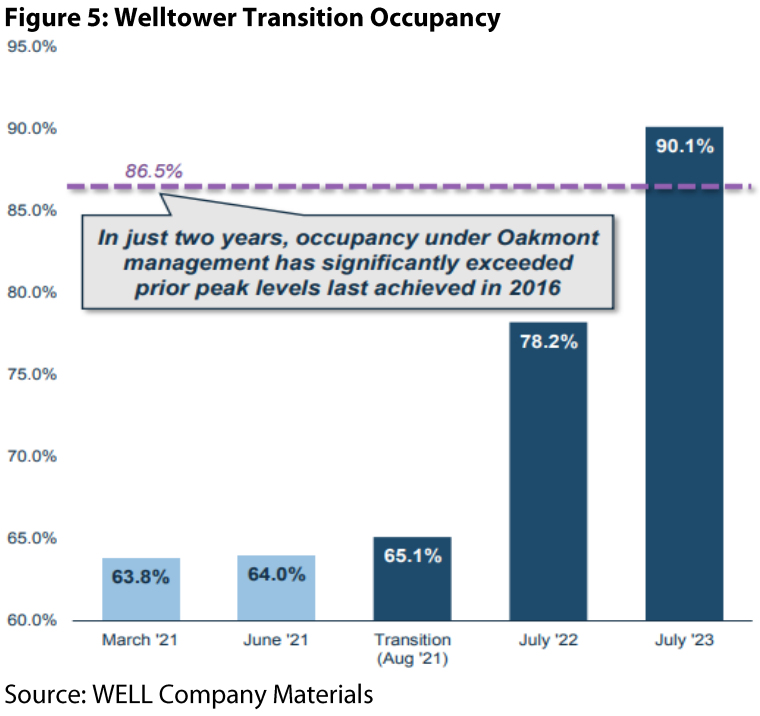
In addition to increasing operating efficiency with current operators, the REITs can also drive growth by ensuring the best operator is paired with an asset. The upside is difficult to quantify, but WELL’s recent success transitioning six properties from Sunrise to Oakmont provides a helpful example. Specifically, WELL initiated the transition in August 2021 based on data analytics predictions. In just two years, spot occupancy increased 2,500 bps, which meaningfully eclipsed pre-pandemic peak occupancy (Figure 5). As a result, annualized NOI in 2Q23 reached $14 million, after generating just $0.6 million for full year 2021.
–
Senior Housing Fundamentals
From a high level, attractive SH fundamentals are a three part equation:
–
1. Demand: The 80+ year old population is growing at the quickest pace in U.S. history. Since 2010, the growth rate has been around 1.7%, but looking forward estimates project a CAGR of 4.4%. To put this into perspective, 4.4% is the highest single year rate in over 52 years. As a result, displayed in Figure 6, the net 80+ population is expected to grow 24% in the next 5 years, compared to just 7% in the 5 years coming out of 2008.

–
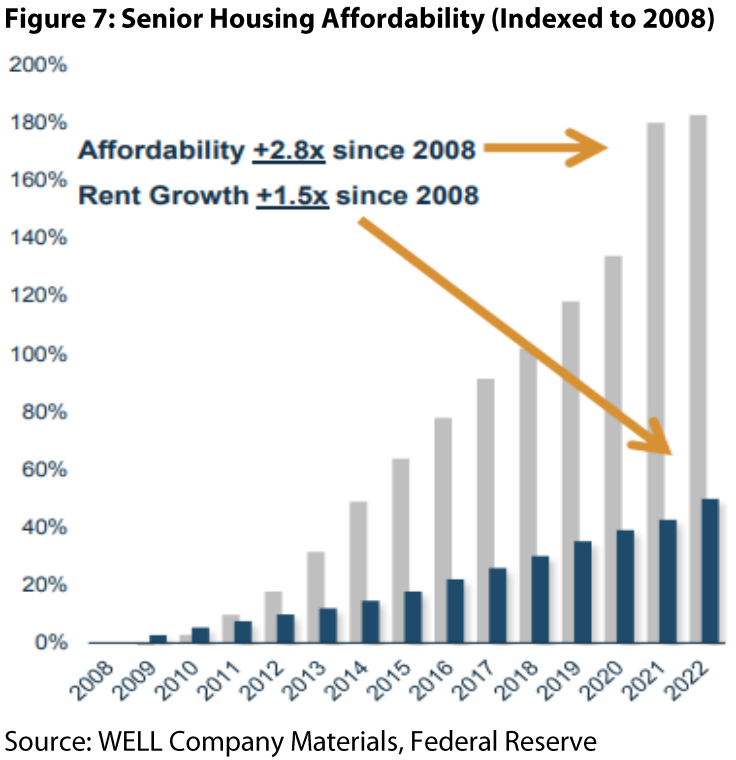
2. Rate/Affordability: Seniors have benefited from strong housing gains and social security adjustments. Additionally, higher interest rates afford yield-dependent seniors more purchasing power. As a result, despite SH rents increasing 50% since 2008, relative affordability is actually up 180% over the same time period (Figure 7).
–
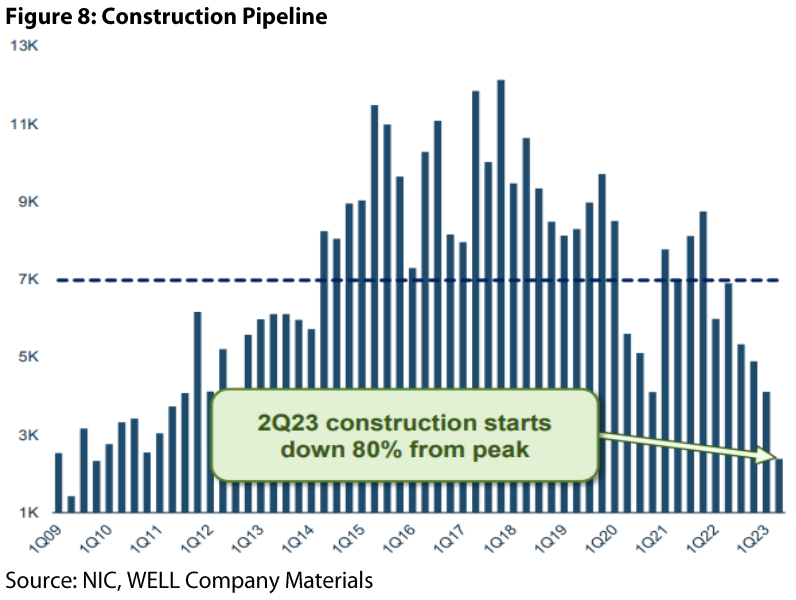
3. Supply: Developers paused SH construction during the pandemic and now, even with the improving outlook, higher construction and financing costs are keeping a lid on new development. Highlighted in Figure 8, as of 2Q23, construction starts have declined 80% from the peak.
–
Risks to the Outlook
The main risk for demand is seniors delaying moving into SH communities until later ages. Longer life expectancies and healthier retirements could certainly push the decision back for some people. Additionally, work from home (WFH) has allowed some workers to care for elderly family members, a trend that could continue if office policies remain flexible. However, we believe the sheer magnitude of the 80+ population growth negates most risk around SH demand.
–
On supply, we certainly expect new construction to pick up in the coming years, particularly if rates normalize. However, there is a meaningful lag in construction time. Even if development starts tick up it will take another 1-2 years before new supply delivers. Finally, healthcare workers were arguably the tightest labor market during the pandemic. More recently, we have seen this trend ease, but long term we expect labor to remain tight and, as such, we model in elevated expense growth.
–
Positioned For Growth
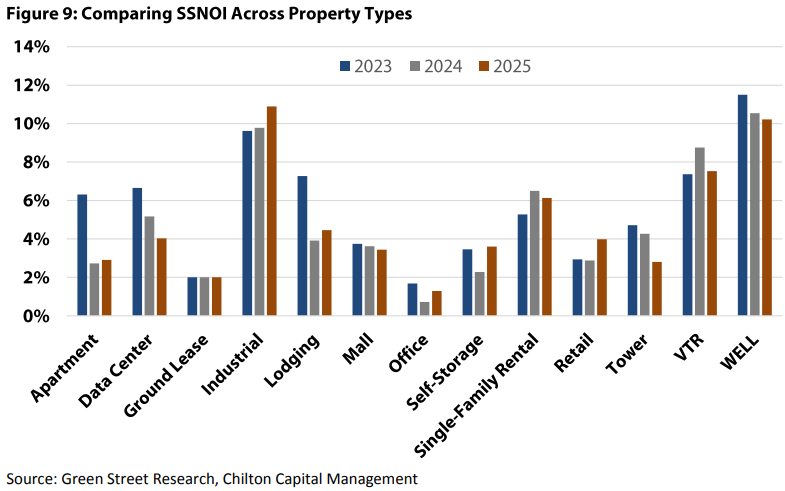
Comparing across the property types in our coverage universe, WELL is expected to have the strongest growth rate in both 2023 and 2024. VTR is not far behind and only modestly trails the industrial group (see Figure 9). Specifically, in 2024, the average REIT is forecast to grow same store NOI (SSNOI) by 3 to 4% (based on a straight average of Green Street’s coverage), while WELL and VTR are expected to grow 10.5% and 8.8%, respectively. Importantly, these projections reflect both companies’ entire portfolios – if we isolated SH growth, the disparity would be even larger.
–
WELL Upside
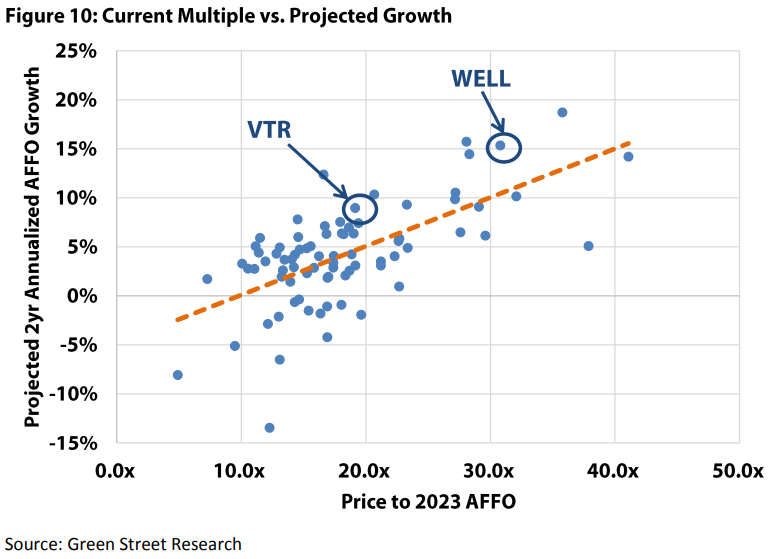
As of September 30, 2023, WELL is trading at a premium to its historic adjusted funds from operations (AFFO) multiple (30.8x 2023 AFFO vs the long term average of 21.3x). However, AFFO growth should be meaningfully above the historical norm for at least several years. Digging deeper, from 2010 to 2019, WELL grew AFFO at an annual rate of roughly 3%. Today, we estimate WELL will grow AFFO by over 15% in both 2024 and 2025. If we convert these multiples to a “PEG type” multiple (Price to Earnings over Growth), the historic average becomes 7.1x (21.3x divided by 3% growth) and the current multiple becomes 2.1x (30.8x divided by 15%). For this ratio, lower is better, as an investor would much rather pay ~31x for a cash flow stream growing mid double digits than pay 21x for 3% growth. In Figure 10, we compare current AFFO multiples to their projected 2 year AFFO growth (annualized). The orange line highlights the average across the REIT universe. Both WELL and VTR are well above normal, meaning both names screen attractive on a growth adjusted basis.
–
Further, WELL is successfully leveraging its net asset value (NAV) premium to ramp up acquisition activity. Specifically, since flipping to “growth mode” at the end of 2020, WELL has completed $9.3 billion of gross investments at an initial yield of 5.9% (compared to today’s implied cap rate of only 4.5%). At a time when other bidders in the fractured Senior Housing space are capital constrained, this is an impactful contributor to AFFO growth.
–
Finally, WELL’s outlook is bolstered by a robust, well-laddered balance sheet (5.6x Net Debt to EBITDA and 6.3 year weighted average maturity) alongside a modest dividend payout ratio (84% of 2023 AFFO). Our internal forecasts project WELL generating ~$280 million of Free Cash Flow (FCF) after paying its dividend in 2024. We are only estimating ~10% dividend growth in 2024 due to our assumption that WELL’s capital allocation continues to focus on external acquisitions. However, due to the strength of earnings growth next year, even with the dividend increasing 10%, we expect the payout ratio to decline in 2024 from 89% to 83%. This provides exceptional flexibility to continue increasing the dividend.
–
VTR Upside
Following recent underperformance, VTR is trading in-line with its historic average even before considering the current growth outlook. Specifically, VTR is trading at 19.1x 2023 AFFO as of September 30, 2023, which is just above the long term average of 18.0x. However, Ventas’ AFFO grew by an average ~4% from 2010-19, which compares to current projections of ~9% in 2024 and 2025. Applying the same PEG methodology as we used for WELL, VTR’s historical growth adjusted multiple is 4.5x (18x divided by 4% growth) and the current multiple would be 2.1x (19.1x divided by 9%). In contrast to WELL, external growth (acquisitions) is mostly off the table for VTR, but if its cost of capital improves, this could present additional upside not contemplated in our model.
–
VTR’s current dividend payout ratio is attractive at only 73% of 2023 AFFO. With AFFO growing roughly 9% next year, Ventas could increase the dividend 10% with effectively no change from today’s payout ratio. However, if we modeled the payout ratio increasing to 80%, the corresponding dividend increase would be 20%.
–
In summary, we believe SH presents one of the best growth outlooks across the REIT universe today. SH is in a rare situation where ramping demand is butting up against minimal new supply. Adding to this fundamental backdrop, the REITs are heavily investing in technology and operational efficiencies to expand margins beyond prior peaks. Both of the major SH REITs retain robust and well-laddered balance sheets, which underpin our expectation for robust long term dividend growth and low risk, even in a rising interest rate environment.
–
Thomas P. Murphy, CFA
tmurphy@chiltoncapital.com
(713) 243-3211
Matthew R. Werner, CFA
mwerner@chiltoncapital.com
(713) 243- 3234
Bruce G. Garrison, CFA
bgarrison@chiltoncapital.com
(713) 243-3233
Isaac A. Shrand, CFA
ishrand@chiltoncapital.com
(713) 243-3219
–
RMS: 2,351 (9.30.2023) vs. 2,398 (12.31.2022) vs. 3,177 (12.31.2021) vs 1,433 (3.23.2020) and 2,560 (2.21.2020)
–
An investment cannot be made directly in an index. The funds consist of securities which vary significantly from those in the benchmark indexes listed above and performance calculation methods may not be entirely comparable. Accordingly, comparing results shown to those of such indexes may be of limited use.)
The information contained herein should be considered to be current only as of the date indicated, and we do not undertake any obligation to update the information contained herein in light of later circumstances or events. This publication may contain forward looking statements and projections that are based on the current beliefs and assumptions of Chilton Capital Management and on information currently available that we believe to be reasonable, however, such statements necessarily involve risks, uncertainties and assumptions, and prospective investors may not put undue reliance on any of these statements. This communication is provided for informational purposes only and does not constitute an offer or a solicitation to buy, hold, or sell an interest in any Chilton investment or any other security. Past performance does not guarantee future results.
Information contained herein is derived from and based upon data licensed from one or more unaffiliated third parties, such as Bloomberg L.P. The data contained herein is not guaranteed as to its accuracy or completeness and no warranties are made with respect to results obtained from its use. While every effort is made to provide reports free from errors, they are derived from data received from one or more third parties and, as a result, complete accuracy cannot be guaranteed.
Index and ETF performances [MSCI and VNQ and FNER] are presented as a benchmark for reference only and does not imply any portfolio will achieve similar returns, volatility or any characteristics similar to any actual portfolio. The composition of a benchmark index may not reflect the manner in which any is constructed in relation to expected or achieved returns, investment holdings, sectors, correlations, concentrations or tracking error targets, all of which are subject to change over time.