Sunbelt Spotlight: Using REITS to Capitalize on Migration | May 2022
Even before the pandemic, a sustained pattern of migration to the Sunbelt was unmistakable, driven by warmer weather, lower taxes, job growth and comparatively very affordable real estate prices (note that although Southern California is sometimes considered the Sunbelt, today’s report will treat California as distinct from the Sunbelt). For example, according to American Counts, Texas added almost 4 million residents during the decade leading into the pandemic. That growth could pale in comparison to the 2020-2025 period, as the increasing remote office environment of the past two years fully illuminated just how many high cost coastal residents would jump to greener pastures when afforded the opportunity. This surge in new, typically well-financed residents has driven Sunbelt real estate prices into overdrive. Most of our readers have likely heard anecdotes about cities such as Austin, Nashville, or Phoenix seeing houses sell for 30%-50% above asking price following a 40 person bidding wars. What may be less publicized is the growth of other property sectors such as retail, multifamily, and even office. In today’s piece we: 1) frame the underlying drivers pushing migration to the Sunbelt, 2) detail our outlook for the future, and, most importantly, 3) communicate how we at Chilton are actively capitalizing on this theme to generate excess returns for clients. Spoiler alert – our portfolio is 653 basis points (bps) overweight to the Sunbelt when compared to the MSCI US REIT Index (Bloomberg: RMZ) as of 4/29/22!
Migration Drivers
Let’s start with taxes. Currently a top tax payer in NY faces a marginal state tax rate of almost 11%; in California, that number stretches to 12.3%. In comparison Florida and Texas (to only name a few) pay 0% in state income taxes. At the risk of belaboring the point, that is a HUGE gap. The desire for top earners to move to these states for the relative tax breaks can create a positive feedback loop whereby companies want to relocate to accommodate these employees, bringing more jobs to the lower tax states, and so forth.
These companies are willing to relocate as long as these states have our second driver: business friendliness. There are many methodologies to calculate business friendliness, but Thumbtack’s annual survey scored Florida, Georgia, and Texas at A, A- and B respectively. While impressive, we think those scores could even be conservative as a cursory headline search shows many notable companies moving their headquarters in the past few years (Hewlett-Packard to Houston, Oracle and Tesla to Austin…the list goes on). How about weather? Well, there is a reason it’s called the Sunbelt. Finally, without getting political, the strict lockdown policies implemented across many coastal cities over the past two years motivated many to seek regions with more focus on personal freedoms.
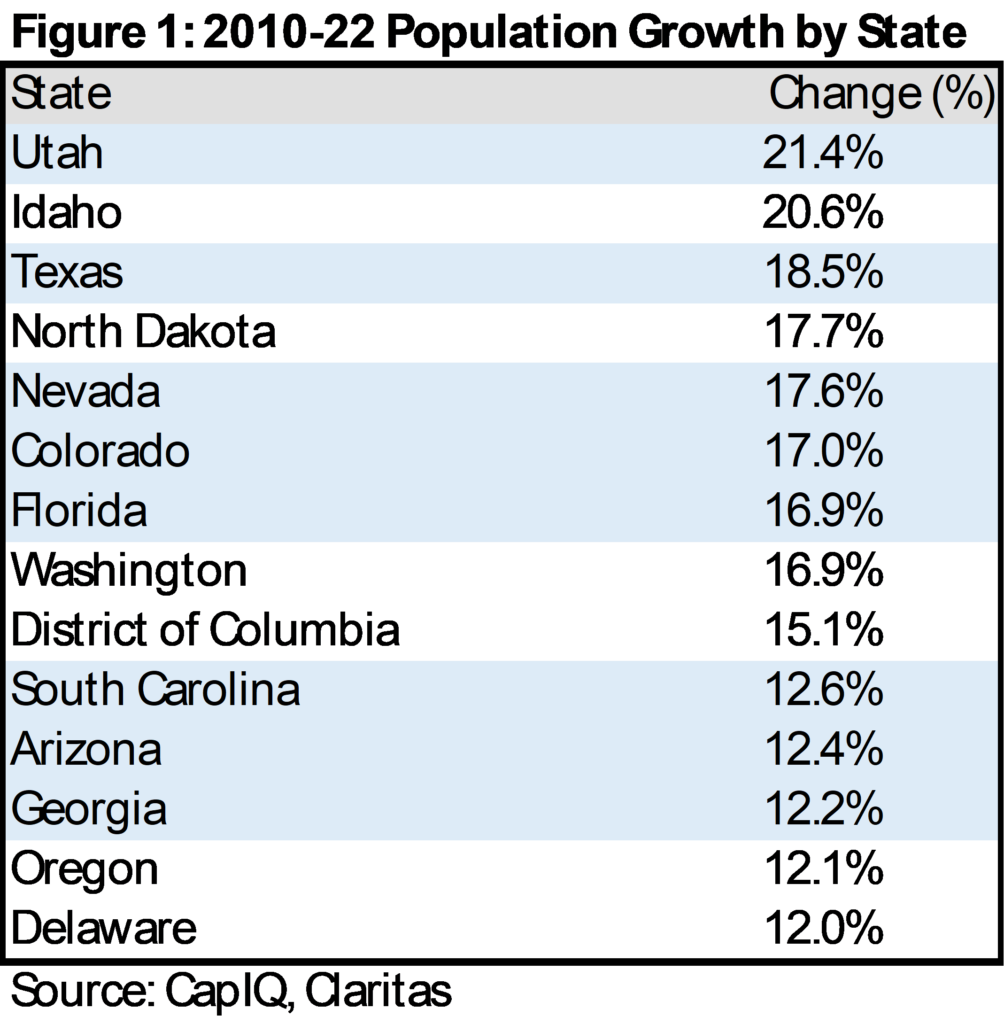
Highlighted in Figure 1, it comes as little surprise that six of the top 15 states for population growth since 2010 are in the Sunbelt. Further, ranking percentage increases skews the list to smaller states. Taking out the states with population less than 5 million, 8 of the top 10 states for population growth are in the Sunbelt. Said another way, Texas’s 18.5% growth is much higher in absolute numbers than Idaho’s 20.6% gain (over 4.5 million vs ~320,000).
Unemployment
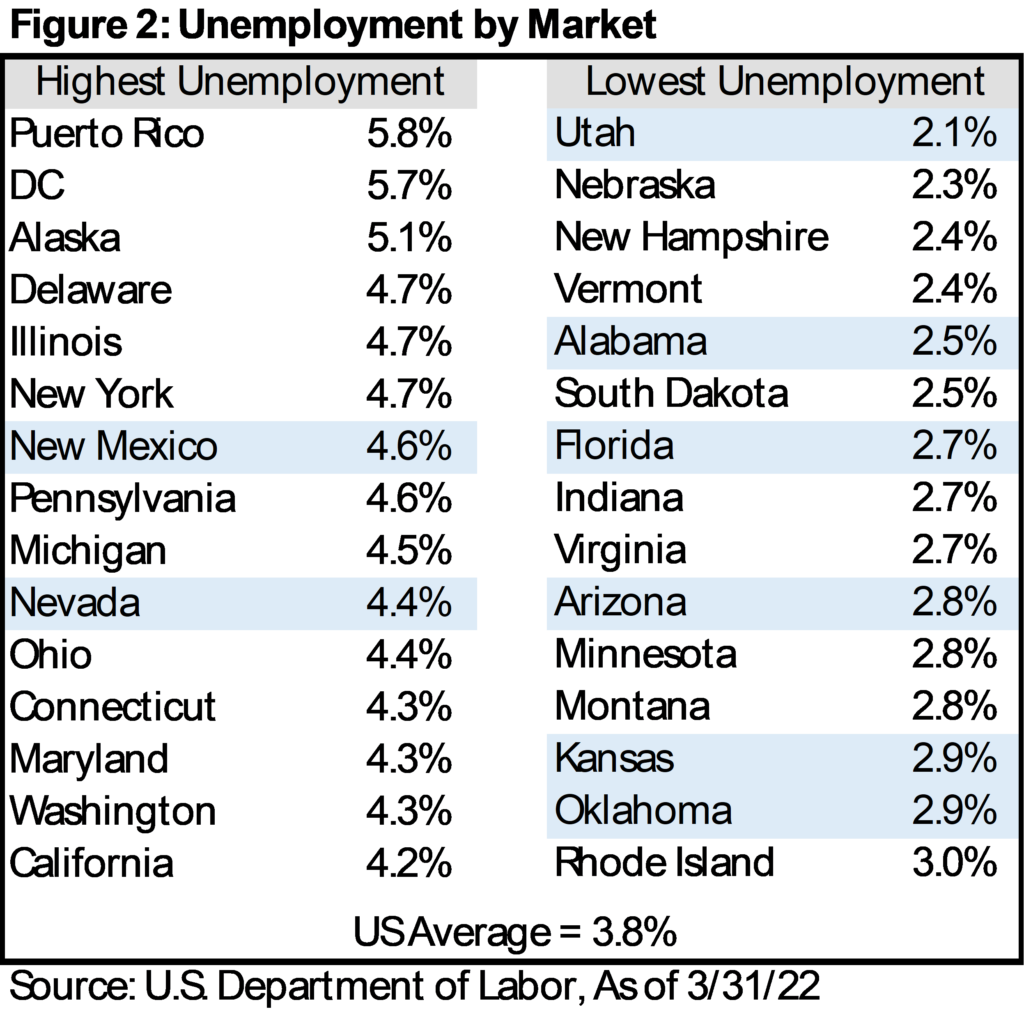
With all of these new residents, has the Sunbelt struggled to find enough jobs? Quite the contrary. As shown in Figure 2, only one Sunbelt market, Nevada, appears in the top 15 unemployment markets. Conversely, the lowest unemployment states are dominated by the upper Midwest and Sunbelt.
Case Study: Austin, Texas
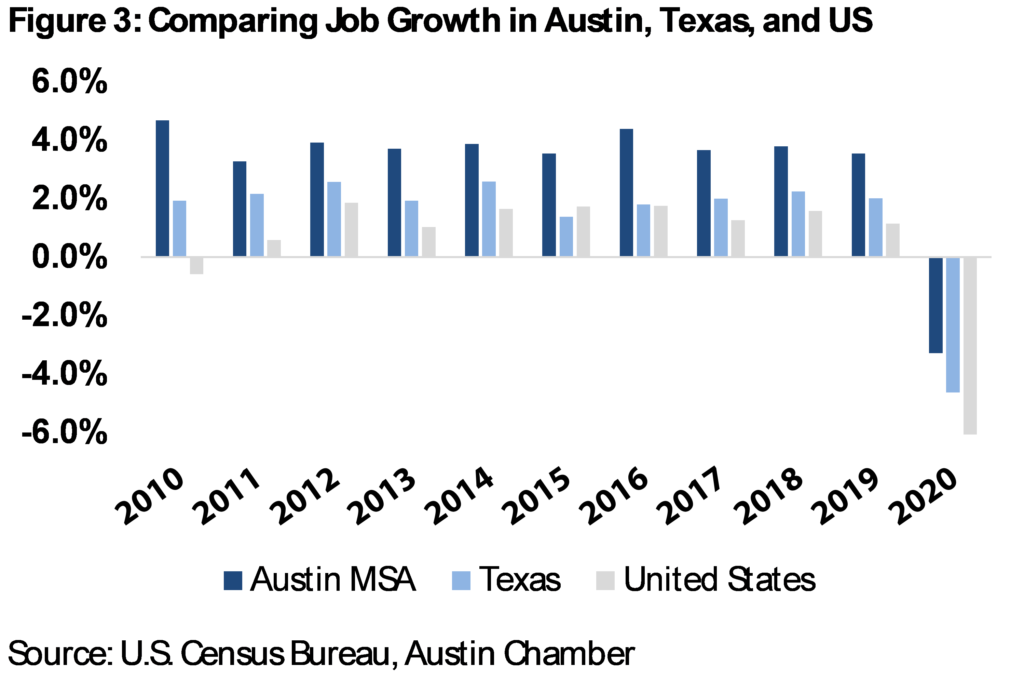
Austin’s population doubled from 2000-2020 and, by most estimates, Texas’s capitol city is expected to double once more over the next 20 years. Austin’s rapid expansion can be thought of as a microcosm for the best factors seen across the Sunbelt – e.g., rapid job growth (especially tech), vibrant college campus, and warm weather. Illustrated in Figure 3, these factors have helped Austin achieve well above average job growth over the past decade. Specifically, from 2010-19 when the entire US increased jobs by ~1.2% per year, Austin grew over triple the US average by increasing employment 3.8% annually. Texas as a whole struggled given its weighting towards the oil and gas industry, but still grew nearly double the pace of the US average (+2.1% per year).
Resilience through the Pandemic
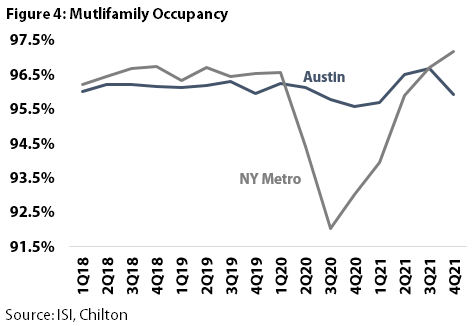
These strong underlying drivers proved quite resilient in the early days of the pandemic. Figure 4 compares multifamily occupancy rates in Austin with the New York City metropolitan service area (or MSA). As one would expect, NYC’s occupancy fell precipitously from over 96% in 1Q20 to below 92% in 3Q20. However, Austin never even fell below 95% occupancy. Austin’s resilience is even more impressive when considering that, according to housing permit data compiled by Rent.com, Austin produced more multifamily units than any metro other than New York (which is 10x the size).
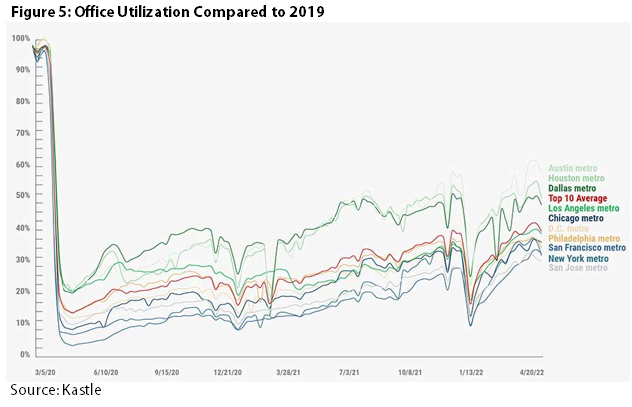
Similarly, there is a substantial discrepancy in office utilization between Gateway and Sunbelt markets. Indeed, Texas holds the top 3 markets with Austin, Houston and Dallas currently around ~50-60% while all of the other markets displayed remain sub 40%. Note this “utilization” number compares daily office card swipes to the same period of 2019, so you can think of the figures as percentage of normal (2019).
Chilton Outlook
In our opinion, the speed of the migration witnessed during the pandemic years likely normalizes, but that doesn’t mean it goes away. Indeed, we expect this normalized level to exceed to trend witnessed in 2010-19, particularly if issues such as homelessness and crime plaguing many major cities deteriorates further. Looking at the underlying factors identified earlier, we don’t see any of them changing in the coming years. Therefore we believe the Sunbelt story is still relatively in the early innings.
Portfolio Positioning
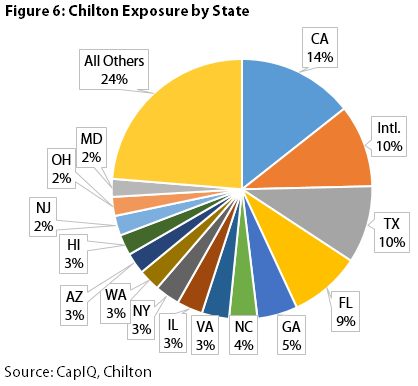
Migration statistics themselves are certainly fascinating, and we strive to provide real estate education to our clients, potential investors, and readers, but the meat of today’s note is how we expect to capitalize on these trends for our clients. Before we go into some of our favorite individual REITs weighted to the Texas growth story, let’s take a higher level look at our portfolio exposure. Figure 6 shows the Chilton REIT Composite’s exposure by state as of 4/29/22. The biggest weightings are California, International, Texas, Florida, and Georgia.
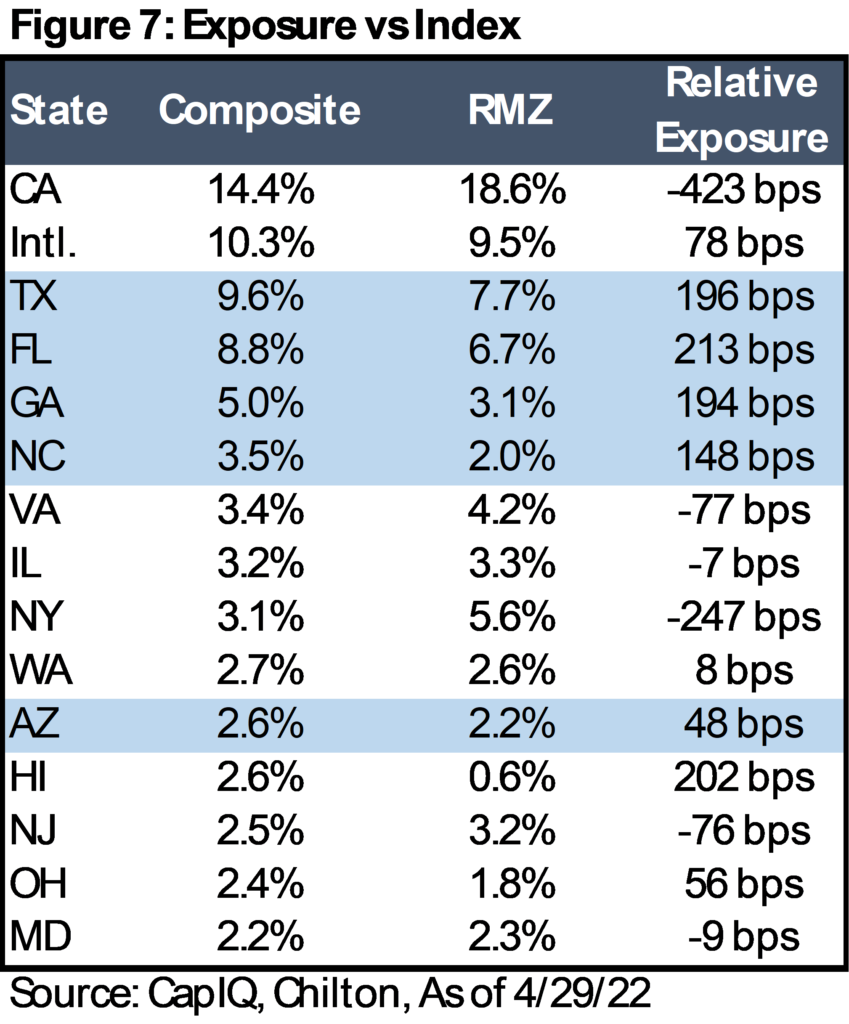
However, as with property type exposure, it is much more informative to observe our positioning relative to the index. Figure 7 shows the index weighting for our 15 largest state weightings. As one can see from the first entry, while California is our largest individual state weighting, we are meaningfully less exposed than the index. Looking at the traditional Sunbelt states, which are highlighted in light blue, the composite is meaningfully overweight to each. Specifically, the Texas weighting is 196 bps above the index, Florida +213 bps, Georgia +194 bps, North Carolina +148 bps and Arizona +50 bps. Overall, we calculate Sunbelt (ex-California) exposure at ~37% versus the index at 31%.
Sunbelt Investment Highlights
Now that we’ve covered our high level exposure to the Sunbelt migration theme, here are a few of the Sunbelt positions we are most excited about:
InvenTrust Properties (NYSE: IVT). We introduced IVT as a new position in the November 2021 Outlook (Retail REITs: Revisited and Reconsidered), where we highlighted the company’s focus on grocer anchored centers located within the Sunbelt. IVT’s largest exposure is to Texas, and more specifically on a city basis, Austin. Since publication in November, management has shown a continued focus and commitment to Austin, acquiring two premier grocery-anchored (one HEB and one Whole Foods/Costco) properties earlier this year for $189 million. Our team had the opportunity to visit both properties earlier this month and our conviction in IVT’s portfolio and strategy has only been reinforced. We are especially positive as the company has yet to gain any sell side research coverage or be included in any index. We believe it’s only a matter of time until both of these occur, bringing in new investors, and potentially serving as a positive catalyst for the stock
Camden Property Trust (NYSE: CPT). Only a few years ago, Camden’s stock price was suffering due to the company’s overweight to Houston multifamily. Fast forward to 4Q21 earnings several months ago where Camden’s Houston portfolio posted same store net operating income (or SSNOI) growth of over 28% (tied for the company’s strongest market with Austin). We’ve long been fans of Camden, but over the past year the company has affirmed itself as one of the premier Sunbelt multifamily operators and one of the first to experiment with single family rentals in the Houston market.
Cousins Properties (NYSE: CUZ). As we’ve discussed previously, we remain wary of the office space in today’s environment. However, we do believe targeted office exposure can perform well. Those that will perform best will be the companies that own the newest buildings in the fastest growing cities. Case in point, Cousins owns a portfolio of trophy buildings across the Sunbelt, with its largest exposure to Austin and Atlanta (collectively 68% of the portfolio).
Conclusion
We believe the migration towards the Sunbelt highlights one of the most compelling investment themes within real estate today. So much street research is devoted to sector selection and then by stock selection that we feel this third leg of the stool may not get the attention it deserves. Although the pandemic has certainly opened many more investors’ eyes to the prospects of cities such as Austin, Tampa, and Atlanta, we still see the migratory shift in its early innings. In our view, the underlying drivers of higher taxes, higher cost of living, less business friendliness, and climate within the Northeast and some California cities are not set to abate and, thus, we see a multi-year growth story playing out across several property types. As we highlighted, our positioning is 653 bps overweight to the Sunbelt than the index, which makes the Chilton REIT Strategy an attractive investment for those looking for a way to play the changing demographics across the country
Thomas P. Murphy, CFA
tmurphy@chiltoncapital.com
(713) 243-3211
Matthew R. Werner, CFA
mwerner@chiltoncapital.com
(713) 243- 3234
Bruce G. Garrison, CFA
bgarrison@chiltoncapital.com
(713) 243-3233
RMS: 2,911 (4.30.2022) vs. 3,177 (12.31.2021) vs 1,433 (3.23.2020) and 2,560 (2.21.2020)
An investment cannot be made directly in an index. The funds consist of securities which vary significantly from those in the benchmark indexes listed above and performance calculation methods may not be entirely comparable. Accordingly, comparing results shown to those of such indexes may be of limited use.)
The information contained herein should be considered to be current only as of the date indicated, and we do not undertake any obligation to update the information contained herein in light of later circumstances or events. This publication may contain forward looking statements and projections that are based on the current beliefs and assumptions of Chilton Capital Management and on information currently available that we believe to be reasonable, however, such statements necessarily involve risks, uncertainties and assumptions, and prospective investors may not put undue reliance on any of these statements. This communication is provided for informational purposes only and does not constitute an offer or a solicitation to buy, hold, or sell an interest in any Chilton investment or any other security. Past performance does not guarantee future results.