Chilton REIT Roadmap, Revisited | April 2022
We are once again peeling back the onion and revealing the secret sauce that has been driving our performance for the past 17 years! It has been eight years since we wrote the April 2014 REIT Outlook titled, ‘The Chilton REIT Roadmap’. Given the recent volatility of stock prices following a broad market increase in 2021, we believe that a bottom-up fundamental investment process is increasingly important. Though the economic environment is different and the process has evolved, the basics remain remarkably similar. Thus, below we refresh the ‘Chilton REIT Roadmap’ for changes made in our process over the past eight years and explain why the process has enabled us to be successful in our goal of outperforming the benchmark by a minimum of 200 basis points (or bps) per year gross of fees over a five year period. In fact, the Chilton REIT Composite has produced annualized outperformance of over 270 bps through March 31, 2022.
Proven Track Record
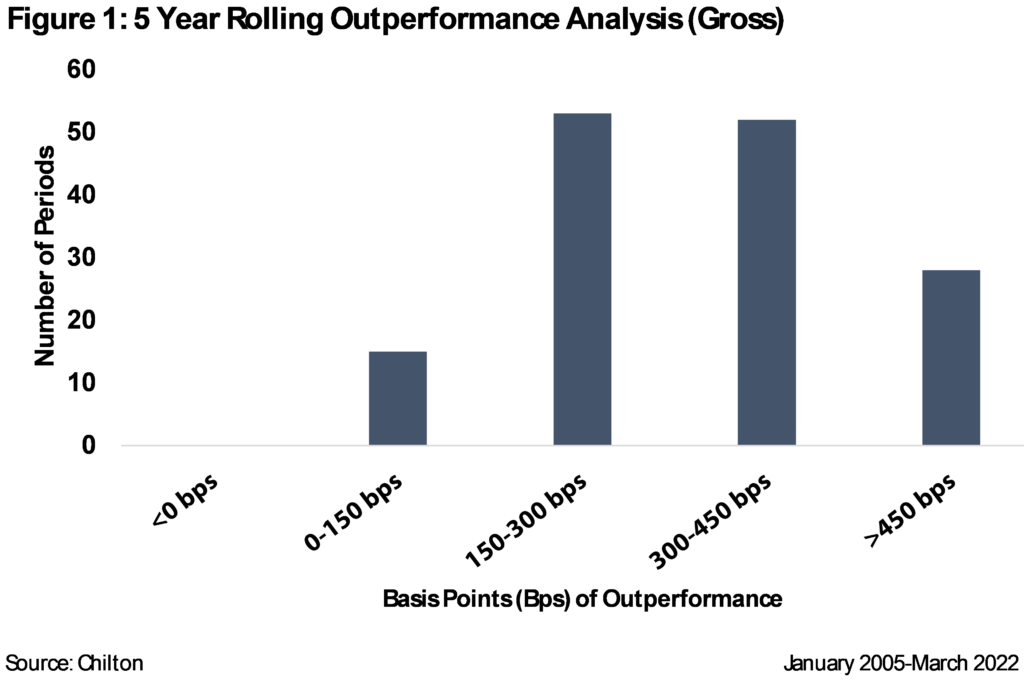
Figure 1 examines all 148 five year periods of performance since inception of the Chilton REIT Composite in January 2005 through March 2022. As shown, we have outperformed the benchmark (MSCI US REIT Index (Bloomberg: RMZ)) in every five year period, both net and gross of fees. The average outperformance for all 148 five year periods has been 328 bps gross of fees per year (239 bps net of fees), well above our goal. On a cumulative basis, the gross outperformance is equivalent to 18% over a five year period!

In fact, the strategy has outperformed by more than 200 bps per year gross of fees in 110 of the 148 periods, or roughly 75% of the time. Looking out further, the strategy has outperformed in 100% of the rolling ten year periods by an average of 331 bps per year. To put that in perspective, 331 bps of annual outperformance over 10 years is equivalent to 38% of cumulative performance. Said differently, a $1 million account invested in the Chilton REIT Composite (‘the Composite) for the average 10 year period would be worth $380,000 more than the benchmark at the end of the period. Additionally, the Chilton REIT Composite produced over 200 bps of outperformance in 76 of the 88 periods, or 86% of the time.
The flexibility of the strategy also has generated a track record of beating the index in rolling three year periods. Specifically, we have outperformed the benchmark in 154 of the 172 rolling three year periods since inception, or 90%. Drilling down further, the few three year periods of underperformance (18 out of 172) produced cyclical high returns for clients. The average three year annualized total return in the 18 periods of underperformance was +16%. Conversely, in the 31 three year periods where the RMZ produced an annualized return below zero, the Chilton REIT Strategy outperformed by an average of 700 bps per year!
Consistent outperformance, especially over periods as short as three years, is difficult to do in the long-only business, especially with a concentrated strategy with a high active share. As of March 31, 2022, the Chilton REIT Strategy had 26 positions, which compares to even our most concentrated peers at closer to 40 or more! ‘Active share’ measures how different a portfolio is than the benchmark. An active share of 100% would be completely different than the benchmark, while an active share of 0% would be exactly the same. As of March 31, 2022, the Chilton REIT Composite had an active share of 62%, which compares to the peer average real estate fund at 52% according to Morningstar as of 12/31/21.
Changes in cycles, macroeconomic environment, and even global pandemics (!) requires both strategic and tactical shifts, both top down and bottom-up prowess, and high conviction during times of uncertainty. We can use attribution analysis to determine the sources of outperformance (or underperformance) over a given period, breaking it out between sector allocation and stock selection. In essence, this analysis tells us if sector allocation (overweight’s and underweights to property types) or stock selection (within sectors) contributed or detracted from relative performance.
Though still instructive over long periods, we believe attribution is especially useful in isolating reasons for outperformance (or underperformance) during a short period that may be a predictor of a future period. For example, a three or a five year period would likely have a mix of periods where stock selection was a positive and negative driver, which may cancel each out. We believe a 12 month period is a short enough period that would show what drove the portfolio performance in a particular environment.
As an example, let’s look at 2020 and 2021, which would be characterized as extremely different markets (summarized in Figure 2). 2020 was characterized by the onset of COVID where unemployment increased to 6.7% by year end and GDP actually declined by 3.4%. In 2020, the RMZ produced a total return of -7.6%, which compared to the Chilton REIT Composite total return of -2.9% gross of fees (-3.7% net of fees). The relative outperformance was entirely attributable to sector allocation, as stock selection was actually a small detractor. In particular, the overweight allocations to the cell tower and data center sectors, along with underweight allocations to shopping centers and regional malls drove the outperformance. Due to the uncertainty around COVID, the market was heavily influenced by the perceived effect on an entire property type, with little differentiation within sectors.

2021 was quite a different market. With the announcement of a vaccine in November 2020, the market began to once again reward individual companies for location, balance sheet, earnings growth, and management team skill. GDP grew by 6.9% and unemployment finished the year at 3.9%. The RMZ produced a total return of +43.1%, the highest calendar year on record, while the Chilton REIT Composite produced a total return of +41.5% gross of fees (+40.5% net of fees). All of the 160 bps of gross underperformance was due to sector allocation, and it would’ve been worse if not for a large contribution from stock selection. The ranking for sector returns almost completely flipped in 2021 from 2020, where regional malls and shopping centers went from the bottom to the top, and cell towers and data centers went from the top to the bottom. As such, underweight allocations to regional malls and shopping centers were a drag, along with an overweight to cell towers. However, the average Diversified REIT in the Composite produced a total return of +51.5%, which compared to +18.5% for the average Diversified REIT in the RMZ, making a significant contribution to relative performance. Notably, two positions in the Diversified sector were added in 2021. Other significant contributors to stock selection were Life Storage (NYSE: LSI) and Plymouth Industrial (NYSE: PLYM) which produced total returns of +98.5% and +121.7%, respectively. Both LSI and PLYM were new positions to the Composite in 2020.
Though the Composite underperformed in 2021, we believe these two periods show the versatility of the process in two completely different markets. The consistent outperformance over longer periods highlights the benefits of remaining disciplined, even when stock selection or sector allocation may not be working as we would hope in the shorter term periods.
Stockpicker’s Market
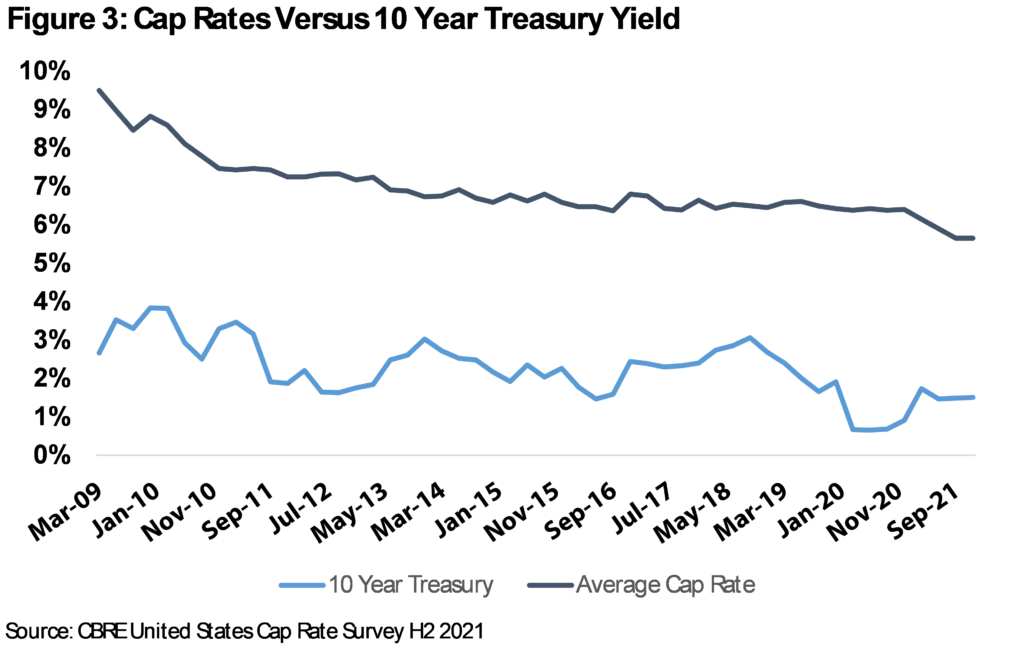
One theme over the past eleven years has been the decline in capitalization rates (or ‘cap rates’). Cap rates are calculative by dividing the market value of a property by the net operating income, or NOI. Lower cap rates results in higher values, keeping all else equal. As shown in Figure 3, cap rates have decreased from nearly 10% in 2009 down to record lows of 5.75% as of December 2021. As a result, commercial real estate investors of almost all types and risk profiles have been able to generate positive returns regardless of respective skill sets, and some fantastically so (especially with leverage!). We believe the next eleven years will not look the same. Although we are not predicting that cap rates will return to 10%, we believe that commercial real estate investors need to be especially selective in what they own (or don’t own) for the intermediate term. Specifically, operating performance of one’s portfolio will increasingly be the primary determinant of achieving target rates of returns. Most equity REITs are focused on one property type and have navigated numerous cycles with great success. Similarly, as we have seen recently, exogenous events can change things quickly, meaning investors need to be able to change with the markets quickly. As such, we believe an actively managed REIT strategy with high active share has the best chance of producing outperformance. We believe our stock selection method, proven over the past 17 years, will be increasingly important.

The Chilton Process
At the heart of our process is a valuation metric called Net Asset Value, or NAV. NAV measures the market value of properties plus cash, construction in process, and other assets, minus liabilities. We then can divide by the number of shares to arrive at an NAV per share. We believe NAV is the best metric to use as a starting point for ‘intrinsic value’ of a REIT as it measures what the REIT is worth if it sold all of its properties and distributed the cash to investors.
There of course are some nuances to calculating NAV. First we must determine an appropriate cap rate to apply to our estimated net operating income (or NOI). The Chilton process is unique in that we project NAV two years into the future. Thus we annualize NOI from eight quarters in the future, and then apply the appropriate cap rate based upon our internal research sources. Our models project NOI that relies heavily upon a combination of organic growth (same store NOI), plus any NOI contribution from new developments, redevelopments, acquisitions, and the non-same store portfolio. Usually the cap rate is adjusted upward (bringing values down) by 20-40 bps reflecting our conservative bias.
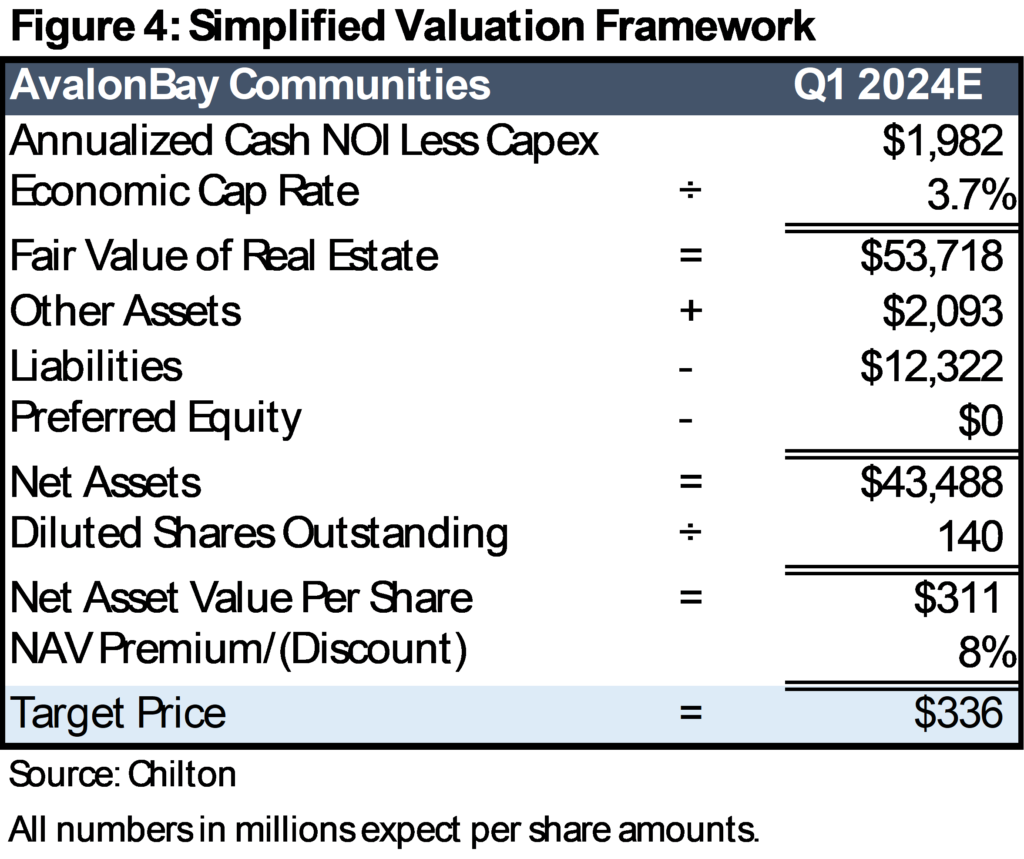
Other assets and liabilities may change in the next eight quarters as well due to the finishing of construction on properties or paying down of debt with free cash flow, etc. Furthermore, share counts are watched carefully due to the need to raise equity in the forecast period. Finally, after arriving at NAV, we apply a proprietary premium or discount to better determine relative value. We use objective assessments of the amount of free cash flow and the related dividend payout ratio, leverage, and general and administrative cost efficiency, plus two subjective assessments (management value creation/destruction and governance), plus a historical sector premium/discount to arrive at a price target. We ardently believe in the benefit that a growing dividend can achieve for a premium valuation and for superb returns for shareholders. Figure 4 shows an example of how we generate a price target for AvalonBay Communities (NYSE: AVB).

The price target is only one step in the process. We then classify the stock between core, value-add, and opportunistic based upon development risk, balance sheet risk, management risk, and dividend risk. In practice, core names have fully leased portfolios and investment grade balance sheets, thus carrying with them less risk than opportunistic names that may have just come public or have above average lease up risk in the portfolio. Each category has a ‘required return’ associated with it based on our assessment of expected long term returns. Therefore, we back into a ‘buy price’ for each of the 89 stocks by calculating the price at which we would need to purchase the stock to achieve the required return. Conversely, the ‘sell price’ is the price at which the two year expected return becomes negative (price target plus two years of dividends).
We also test the price target for reasonability by observing the multiple of adjusted funds from operations, or AFFO. For example, we can compare AFFO multiples between stocks to determine if our process has missed something. Furthermore, we can assess whether the assumption that AFFO multiple is increasing or decreasing seems reasonable.
In the past eight years, we have also had to evolve with the changing market. Notably, REITs have attracted more generalist investors who may not be as familiar with NAV and the use of cash flow metrics rather than earnings per share. For some sectors and stocks, we incorporate EBITDA multiples (earnings before interest, taxes, depreciation, and amortization), FFO multiples (funds from operations), and free cash flow multiples. We welcome these new investors, and stand ready to adjust our process as needed going forward as things change again.
As evidenced by two year price targets and several valuation factors based on long term averages, we do not expect this process to produce positive results over the short term, or to even work 100% of the time. However, we believe our goal of outperforming by 200 bps over a five-year period can be achieved through this process, as we have proven over the past 17 years. We have been humbled by the market many times, and understand that there will always be the ‘unknown unknowns’ that could upend a theme, sector, or company. Therefore, we will continue to hone this process and look forward to providing another Chilton REIT Roadmap in eight years (the year 2030!).
Matthew R. Werner, CFA
mwerner@chiltoncapital.com
(713) 243- 3234
Bruce G. Garrison, CFA
bgarrison@chiltoncapital.com
(713) 243-3233
Thomas P. Murphy, CFA
tmurphy@chiltoncapital.com
(713) 243-3211
RMS: 3,047 (3.31.2022) vs. 3,177 (12.31.2021) vs 1,433 (3.23.2020) and 2,560 (2.21.2020)
An investment cannot be made directly in an index. The funds consist of securities which vary significantly from those in the benchmark indexes listed above and performance calculation methods may not be entirely comparable. Accordingly, comparing results shown to those of such indexes may be of limited use.)
The information contained herein should be considered to be current only as of the date indicated, and we do not undertake any obligation to update the information contained herein in light of later circumstances or events. This publication may contain forward looking statements and projections that are based on the current beliefs and assumptions of Chilton Capital Management and on information currently available that we believe to be reasonable, however, such statements necessarily involve risks, uncertainties and assumptions, and prospective investors may not put undue reliance on any of these statements. This communication is provided for informational purposes only and does not constitute an offer or a solicitation to buy, hold, or sell an interest in any Chilton investment or any other security. Past performance does not guarantee future results.